SNDK 25-day bearish forecast — Nov 9, 2026
- Bias: Bearish
- Timeframe: 25 days (made Nov 9, 2026, target date Dec 4, 2026)
- Price at analysis: $869.44
- Price target: $830.00
- Expected range: $760.00 – $905.00
- Result: Pending — graded after the close on Dec 4, 2026
Get a free AI analysis of SNDK today
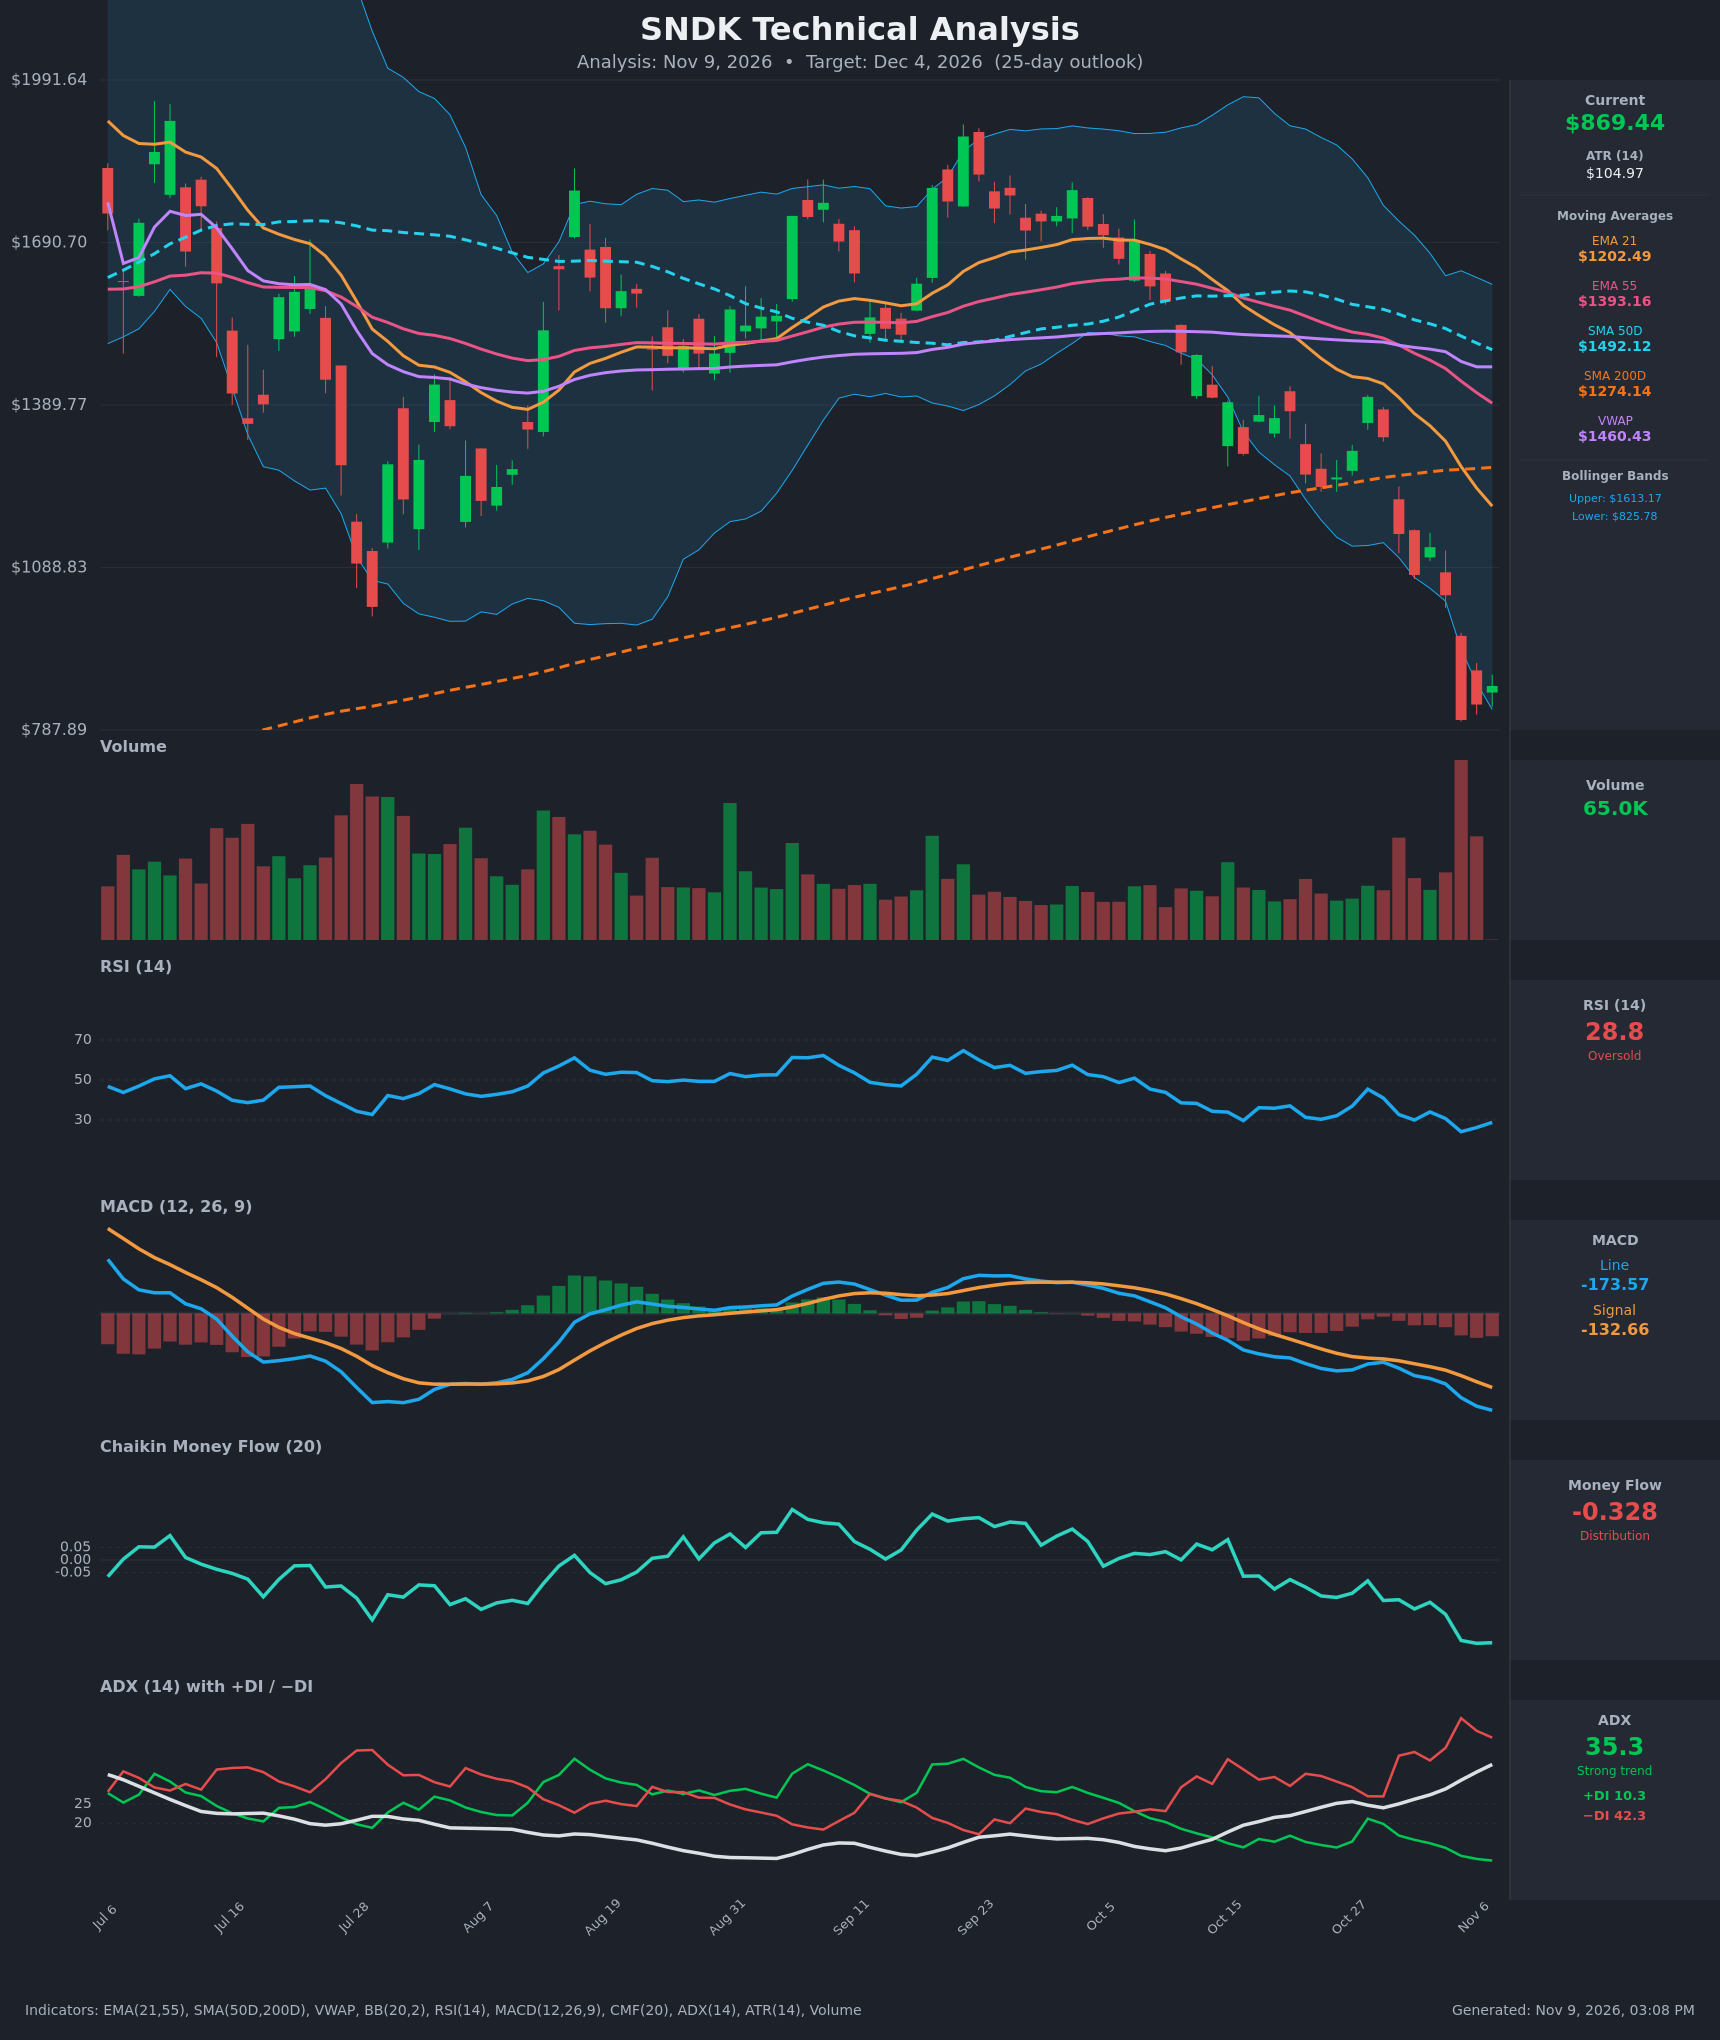
Analysis
TECHNICAL INDICATORS
- RSI (14): 28.81, back in oversold territory after printing 24.1 on Nov 5. It has ticked up for two sessions (24.1 → 26.3 → 28.8), which suggests a relief bounce. There is no bullish divergence yet, because RSI is still making lows alongside price. [Bearish]
- 20 EMA (EMA 21): $1,202.49, with price about 28% below it. It is falling steeply (from $1,538 on Oct 20) and sits below the EMA 55 ($1,393.16). It acts as heavy overhead resistance. [Bearish]
- MACD: Line -173.57 is below signal -132.66, and the histogram is about -41 and widening. The line has stayed below the signal for the whole recent stretch with no sign of a cross back up. [Bearish]
- Bollinger Bands (20): Upper $1,613.17, lower $825.78. Price at $869.44 is near the lower band after walking it down and briefly piercing it on Nov 5. The bands are very wide, which signals high volatility. A band walk in a strong downtrend is more often continuation than reversal, though a bounce toward the midline is possible. [Bearish]
- CMF (20): -0.328, well below -0.05 and at its lowest reading in the visible period. It has fallen steadily from -0.08, which means heavy, persistent distribution. [Distribution]
- ADX (14): 35.3 and rising (21.5 → 35.3 over 15 bars). −DI at 42.3 is far above +DI at 10.3, so sellers dominate. This is a strong, accelerating downtrend. [Strong Trend – Bearish]
- Volume: The latest bar is 65.0K, a light-volume bounce following the heavy-volume capitulation bar on Nov 5. The bounce lacks buyer conviction, and volume has been highest on the red down days. [Bearish – weak bounce]
Other moving averages and VWAP:
- Price is below the SMA 200D ($1,274.14), below the SMA 50D ($1,492.12) and below VWAP ($1,460.43). All of these are overhead resistance.
- The SMA 50D is still above the SMA 200D, so no death cross has occurred yet, but the gap is closing quickly.
- The EMA 21 crossed below the EMA 55 earlier, and that bearish alignment persists.
DIVERGENCES & TRENDS
- Divergences: There is no bullish divergence. RSI, MACD, CMF and ADX all made new extremes with the Nov 5 breakdown. Momentum confirms price.
- Trend: Price fell from about $1,400 on Oct 28 to $806 on Nov 5, a drop of roughly 42%. That sequence of lower highs and lower lows is accelerating.
- Breaks: Price lost the SMA 200D, the long-term trend line, in late October and has not reclaimed it. Every bounce has failed below the EMA 21.
- Oversold context: RSI under 30 and price roughly 3 ATR below the EMA 21 make a snap-back rally likely at some point. Oversold conditions can persist in strong trends (ADX 35, −DI 42), so a bounce would likely be a relief rally, not a trend change.
- Stabilization signal: Two small up-closes ($835, $869) after the capitulation candle show early stabilization, but on thin volume.
CHART PATTERNS
- Large double-top / distribution structure: The July and September highs near $1,800–$1,850 look like a double top. The neckline sits around the $1,250 trough and the SMA 200D area, and price has broken below it. A measured move (roughly $600 of height) points toward the $650–$700 zone over a longer horizon. That is beyond a 25-day window, but it supports downside risk.
- Bearish continuation / possible flag: Since the Nov 5 capitulation, the small upward drift is consistent with a bearish flag or pennant. A break below $806 would confirm it.
- Falling wedge (bullish reversal, unconfirmed): The lower highs and lower lows could resolve into a falling wedge, but there is no converging structure or volume contraction, so this is not valid yet. A close back above about $1,040 would be the first sign of a trend change.
POTENTIAL SCENARIOS
- Scenario 1: Bearish Trend Continuation — Sellers keep control (−DI 42 vs +DI 10, CMF -0.33). The light-volume bounce fades under the EMA 21 and the Nov 5 low gives way. Trigger: rejection near $920–$960, then a daily close below $806. Target: $760–$800, with an extension toward $700. Invalidation: daily close above $1,037. (50% probability)
- Scenario 2: Bullish Oversold Relief Bounce — RSI under 30 and price at the lower Bollinger Band attract dip buyers, producing a mean-reversion rally toward the middle of the gap. Trigger: a close above $925 on rising volume with RSI back above 35. Target: $950–$1,040 (the Nov 4 close). Invalidation: close below $806. (35% probability)
- Scenario 3: Neutral Basing Range — Price chops between $806 and $930 as volatility cools and the market digests the capitulation. Trigger: several sessions of tight ranges and declining volume. Target: $820–$900. Invalidation: close outside $790–$960. (15% probability)
PRICE TARGETS
- Target Price: $830.00 (25 days, Dec 4, 2026)
- Expected Range: $760.00 to $905.00 (width $145, about 16.7% of current price, consistent with the 25-day timeframe)
- Key Levels: Support at $806.43 (Nov 5 capitulation close), Resistance at $1,037.40 (Nov 4 close and gap origin)
OVERALL BIAS
OVERALL BIAS: BEARISH - Every trend and momentum indicator confirms the downtrend: ADX 35 and rising with −DI 42 dominant, MACD widening below its signal, CMF at -0.33, and price below every major moving average and VWAP. The oversold RSI and the light-volume bounce argue for a relief rally, but those bounces have been selling opportunities and the Nov 5 low is likely to be tested.
This is educational analysis and not financial advice.