SNDK 23-day bearish forecast — Nov 18, 2026
- Bias: Bearish
- Timeframe: 23 days (made Nov 18, 2026, target date Dec 11, 2026)
- Price at analysis: $777.55
- Price target: $690.00
- Expected range: $301.00 – $1320.00
- Result: Pending — graded after the close on Dec 11, 2026
Get a free AI analysis of SNDK today
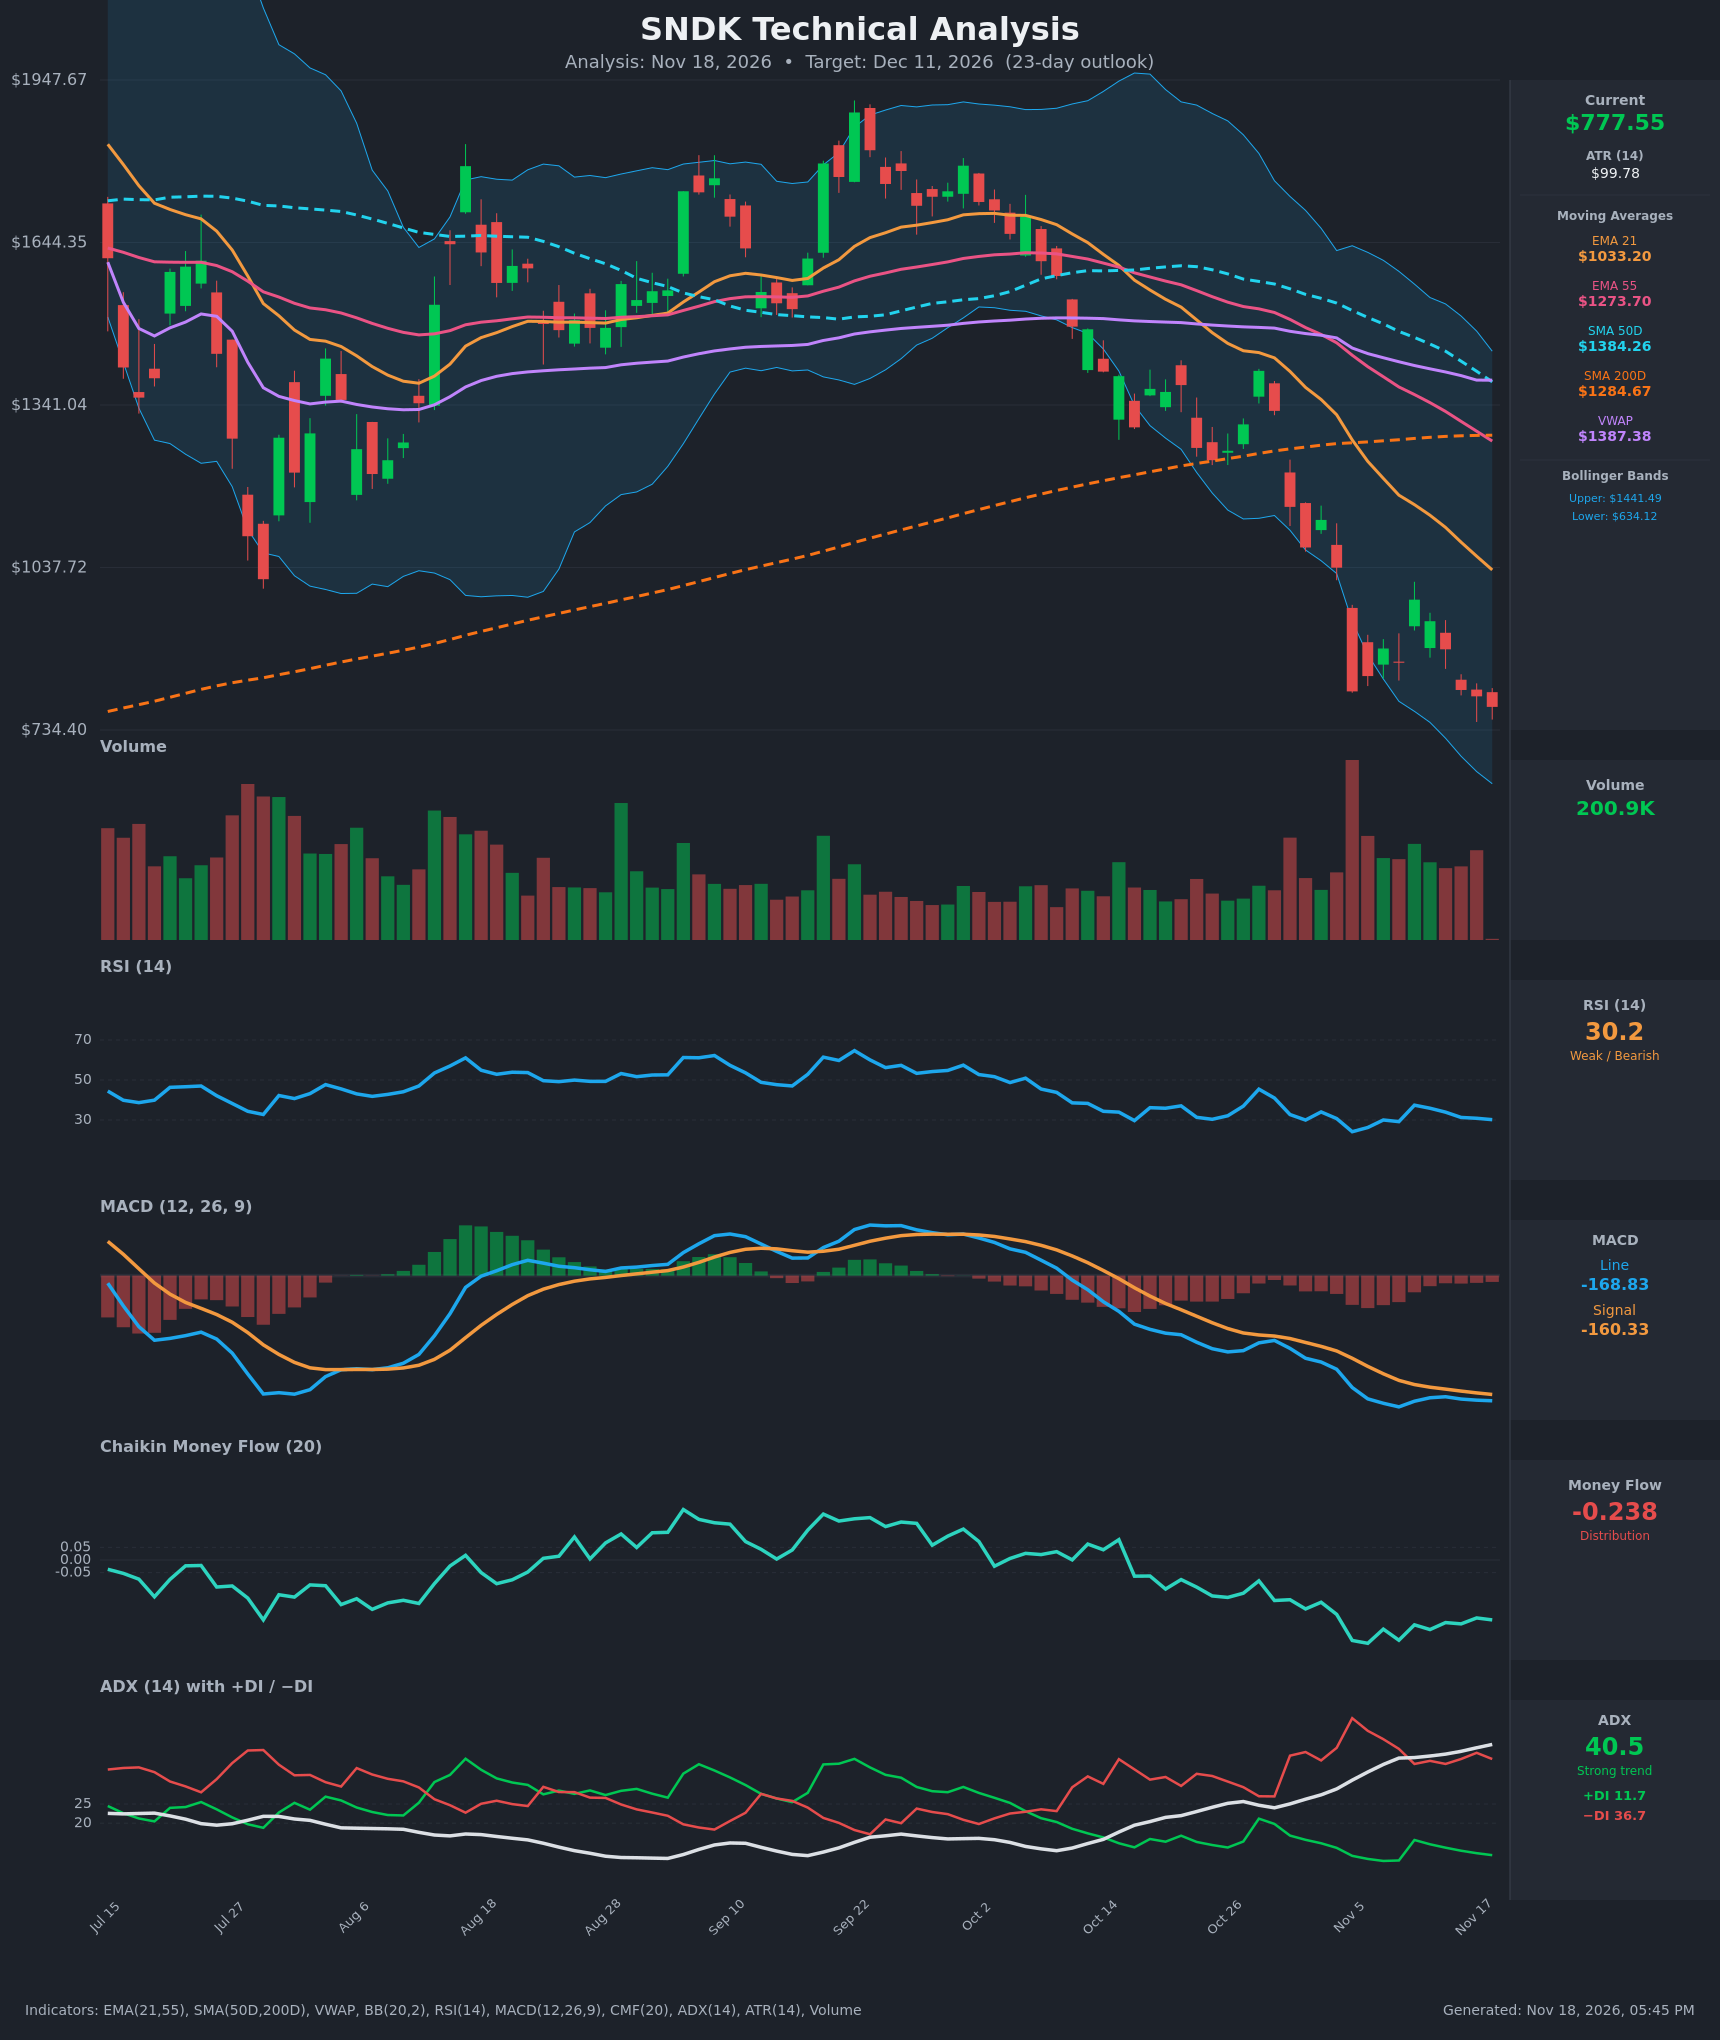
Analysis
TECHNICAL INDICATORS
- RSI (14): 30.16, sitting right at the oversold line. It fell from 41 on Oct 29 to a low of 24.1 on Nov 5, bounced to 37.4, and has since rolled over again. Price made a lower low ($777.55 vs. $806.43 on Nov 5) while RSI made a higher low (30.2 vs. 24.1). That is a mild bullish divergence, but RSI is still trending down and has not turned up. [Bearish]
- Moving Averages: Price ($777.55) is below every average. EMA 21 ($1033.20), EMA 55 ($1273.70), SMA 50D ($1384.26), SMA 200D ($1284.67) and VWAP ($1387.38) all act as overhead resistance. EMA 21 crossed below EMA 55 well before this window and the gap is widening. SMA 50D is still above SMA 200D but falling quickly (about $1567 → $1384 in 15 bars), so a death cross is likely within weeks. Price is about 40% below SMA 200D, an extremely stretched reading. [Bearish]
- MACD: Line -168.83 is below signal -160.33, so the histogram is -8.5. Both lines are deeply negative and still falling. The histogram has shrunk from about -36 on Nov 10, so downside momentum is decelerating, but there is no bullish crossover yet. [Bearish]
- Bollinger Bands (20): Upper $1441.49, lower $634.12, middle about $1038 (roughly where EMA 21 sits). Price is in the lower quarter of the band, about 18% above the lower band. The bands are very wide, so volatility is elevated. Price has been walking the lower half of the bands since mid-October, which is typical of a strong downtrend. [Bearish]
- CMF (20): -0.238, well below -0.05. It has stayed negative for many weeks and bottomed near -0.33 on Nov 5-6. It is improving slightly but still shows heavy distribution. [Distribution]
- ADX (14): 40.5 and rising steadily (24 → 40.5 over 15 bars), a strong trend. −DI (36.7) is far above +DI (11.7), so sellers are firmly in control. [Strong Trend – Bearish]
- Volume: The latest reading of 200.9K looks like a partial or light session, since the final bar on the chart is nearly empty. The largest volume spike was the heavy red bar around Nov 5, which was a capitulation-style breakdown. Subsequent bounces came on modest volume, which is typical of weak relief rallies. [Bearish – weak bounce participation]
DIVERGENCES & TRENDS
- RSI vs. price: A minor bullish divergence (price lower low, RSI higher low) hints at selling exhaustion. It is a warning for bears, not a reversal signal.
- MACD histogram: The negative histogram is contracting, so downside momentum is cooling. A bullish crossover would need the line to climb above -160.
- ADX/DI: The ADX uptrend with −DI dominant confirms a mature, strong downtrend. ADX above 40 can also flag a late-stage move that is prone to sharp snap-back rallies.
- CMF: It has made a lower low than at the late-September trough and remains deeply negative, which confirms the price decline rather than diverging from it.
- Moving averages: Price, EMA 21 and EMA 55 are stacked in bearish order. SMA 50D is converging toward SMA 200D (about $100 apart), pointing to a probable death cross.
- Breaks: The break below SMA 200D in mid-October and the heavy Nov 5 breakdown (-$231 in one day) were the key bearish breaks.
CHART PATTERNS
- Bearish flag/pennant (continuation): After the sharp drop on Oct 30–Nov 5, price bounced to about $977 and rolled over in a lower-high sequence. This matches the Bearish Flag Pattern in the diagram, and a breakdown continues the trend lower.
- Broader structure: Price has fallen from a September peak near $1,900 in a clear sequence of lower highs and lower lows below falling EMAs. This is a textbook downtrend, with a failed double-top-like structure around $1,700–$1,900.
- Target: A flag-pole measured move (about $230 on the Nov 5 leg) from a $780–$800 breakdown points to roughly $550–$600. The first meaningful support is at $634 (lower Bollinger Band).
- Caveat: Price is far from its averages and near oversold, so relief rallies toward $950–$1,030 (the EMA 21 area) are likely along the way.
POTENTIAL SCENARIOS
- Scenario 1: Bearish Trend Continuation — Sellers remain in control (−DI 36.7, ADX 40.5), and rallies fade at falling averages. Price breaks the recent low near $734 and drifts toward the lower Bollinger Band. Trigger: daily close below $734. Target: $600–$690, with an extension toward $500. Invalidation: daily close above $977 (the Nov 11 bounce high). (50% probability)
- Scenario 2: Bullish Oversold Relief Rally — RSI divergence, a shrinking MACD histogram and extreme extension below the averages trigger a sharp short-covering bounce. Trigger: RSI turns up through 37 and price reclaims $880–$900. Target: $1,030 (EMA 21) with a possible stretch to $1,150. Invalidation: close back below $734. (35% probability)
- Scenario 3: Neutral Base Building — After the capitulation, price chops between about $730 and $950 as momentum bleeds off. Trigger: failure to break either $734 or $977 for several sessions. Target: a $750–$850 range. Invalidation: a decisive close outside $734–$977. (15% probability)
PRICE TARGETS
- Target Price: $690.00 (23-day horizon)
- Expected Range: $301.00 to $1320.00 (about 2x the typical move wide, shifted down toward the bearish bias)
- Key Levels: Support at $734.40, Resistance at $1033.20
OVERALL BIAS
OVERALL BIAS: BEARISH - Price sits below all key moving averages with ADX at 40.5, −DI far above +DI, CMF showing persistent distribution, and MACD still below its signal line. The oversold RSI and its mild divergence raise the odds of a sharp bounce, but the bearish flag structure and weak-volume rallies favor further downside over the next 23 days.
This is educational analysis and not financial advice.