SHEL 1-day bearish forecast — Nov 5, 2026
- Bias: Bearish
- Timeframe: 1 day (made Nov 5, 2026, target date Nov 6, 2026)
- Price at analysis: $100.81
- Price target: $100.45
- Expected range: $99.75 – $101.60
- Result: Correct (-0.8%) — closed at $99.99 on Nov 6, 2026; quality score 100/100
Get a free AI analysis of SHEL today
Analysis
TECHNICAL INDICATORS
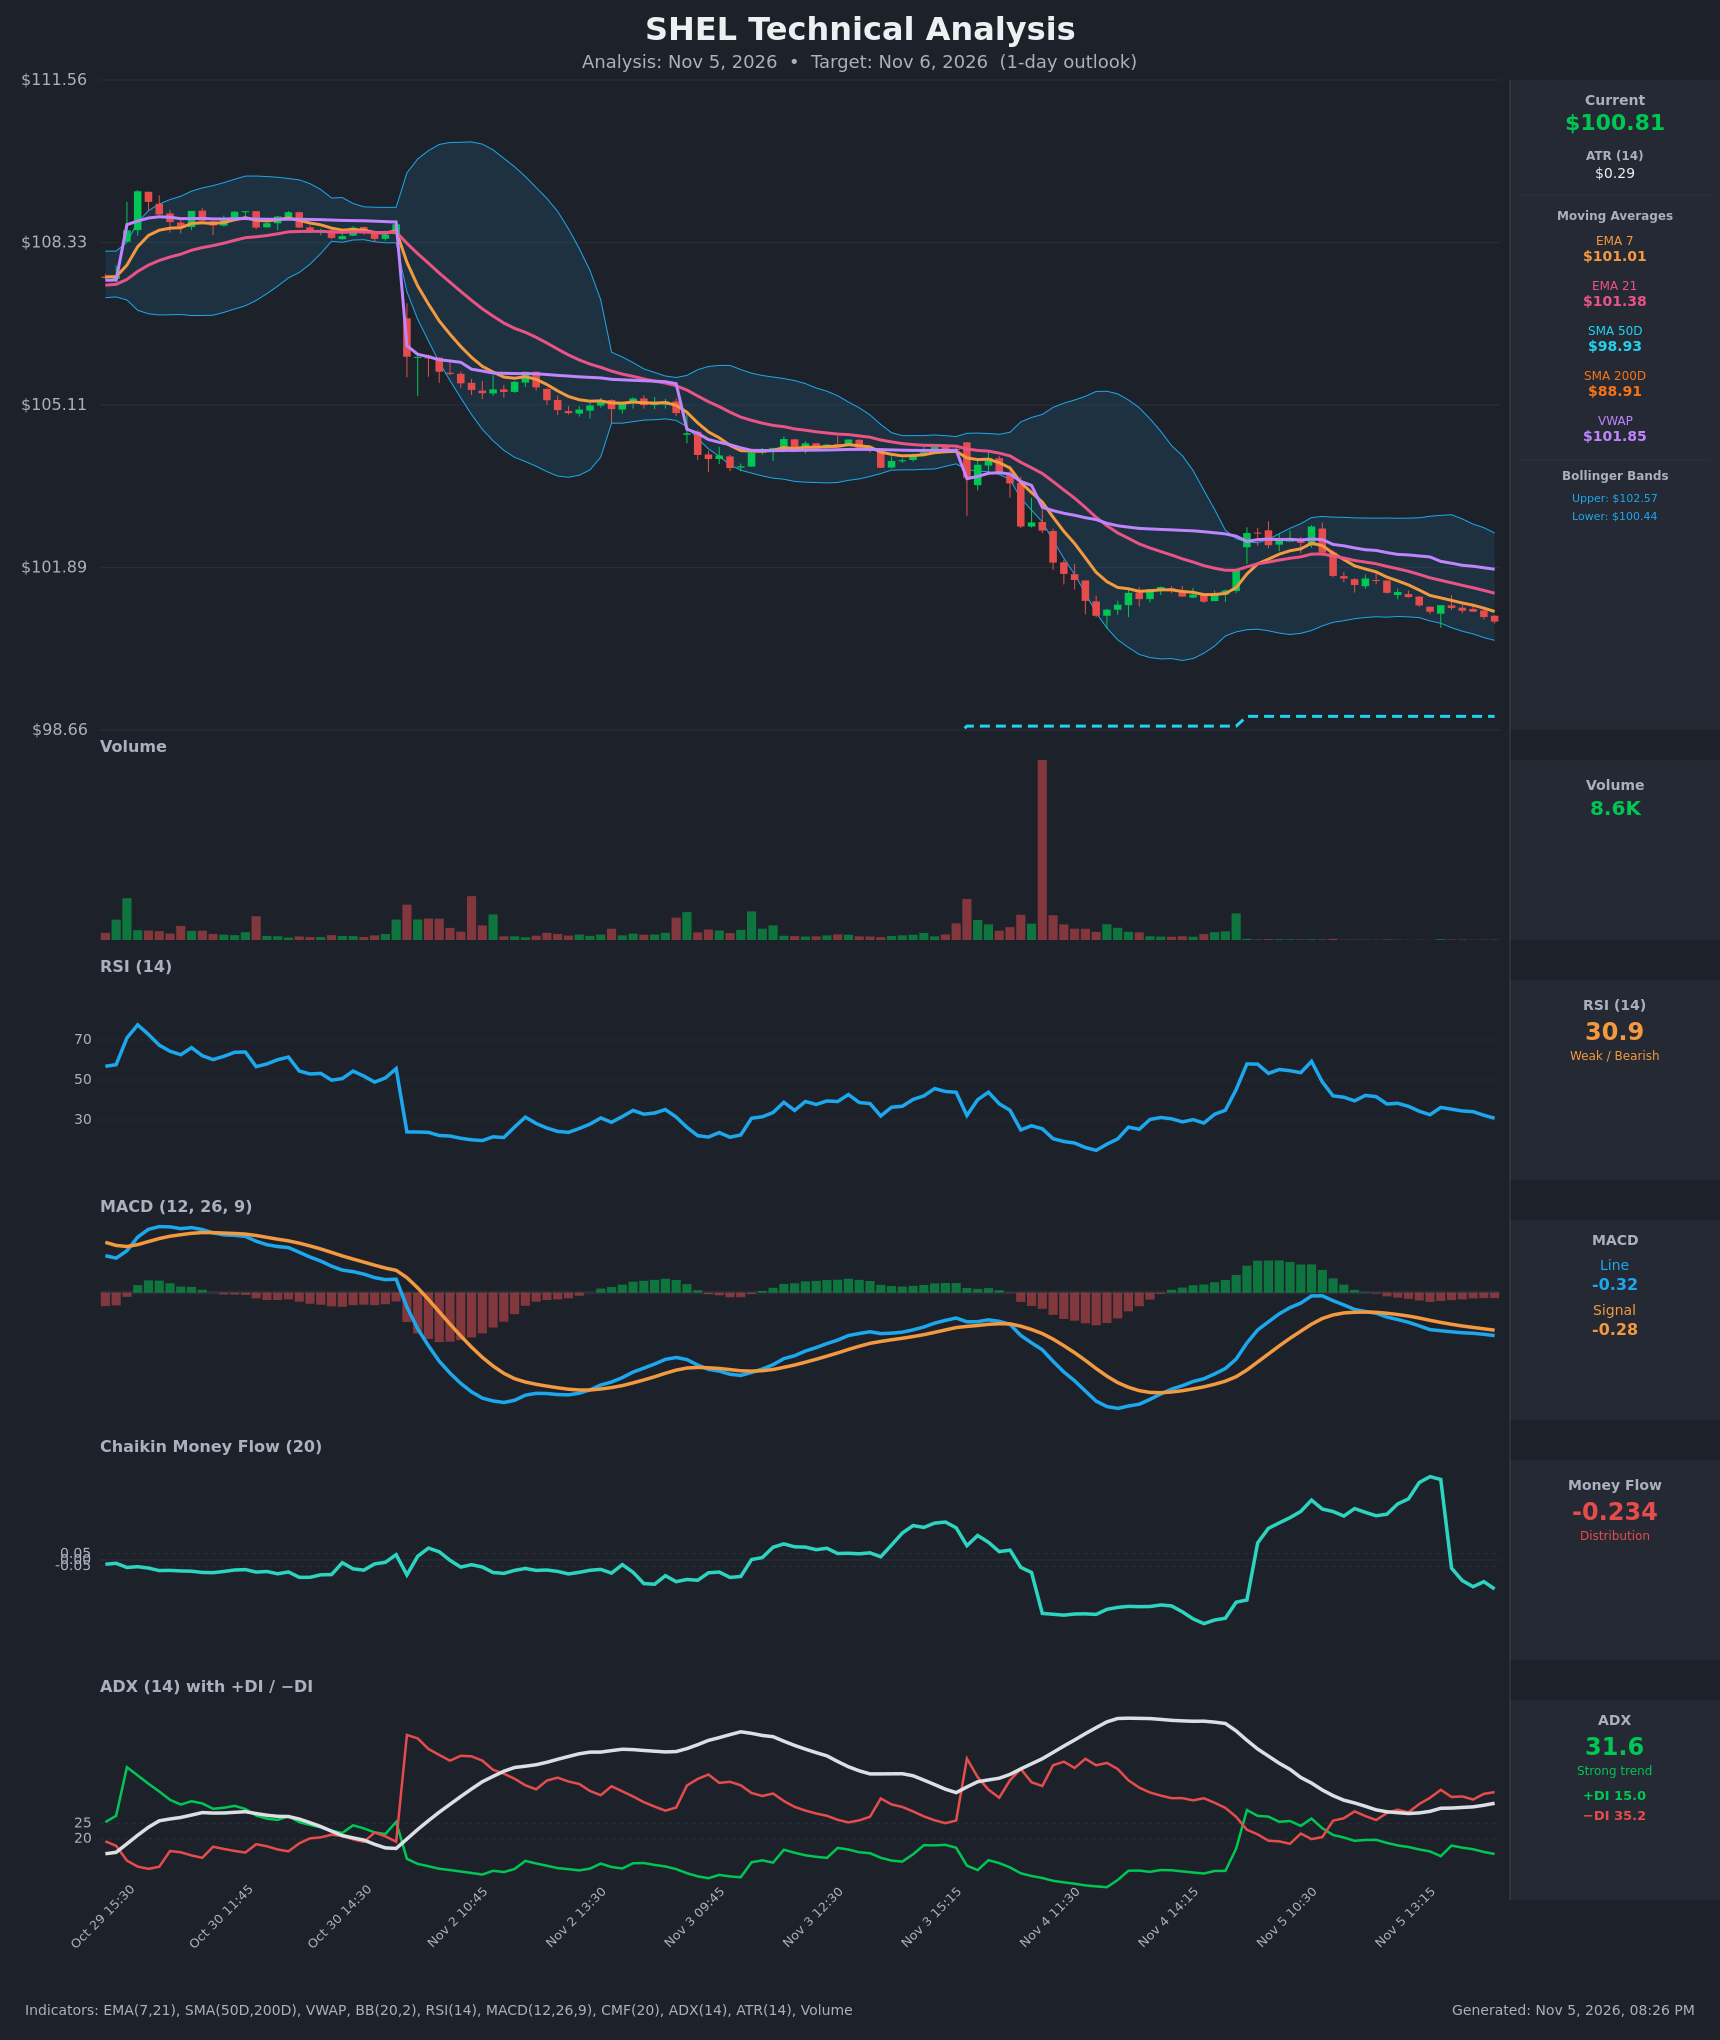
- RSI (14): 30.87, right at the oversold threshold and falling steadily from about 42 early in the session. Momentum is still down, but selling is stretched, so a bounce is possible. [Bearish]
- 20 EMA: EMA 7 is $101.01 and EMA 21 is $101.38 (the closest proxy for the 20 EMA). Price at $100.82 is below both, and EMA 7 is below EMA 21, so both act as overhead resistance. [Bearish]
- MACD: The line (-0.3205) is below the signal (-0.2798) and the gap is widening, so the histogram is negative and growing. The bearish crossover is already in place and has not turned yet. [Bearish]
- Bollinger Bands (20): Price at $100.82 is close to the lower band ($100.44) and well below the middle band (about $101.5). The bands are fairly narrow, so there is no volatility expansion. Price is walking down the lower half of the bands. [Bearish]
- CMF (20): -0.234, down from +0.6 earlier in the session. Money flow has swung sharply into distribution. [Distribution]
- ADX (14): 31.6 and rising slightly, with −DI (35.2) well above +DI (15.0). This is a strong, established downtrend with the bears firmly in control. [Strong Trend – Bearish]
- Volume: 8.6K, very light, and the recent bars show almost no participation. The drift lower is on thin volume, which gives less conviction in either direction. The large red spike earlier in the week marked the distribution. [Neutral / Weak Confirmation]
DIVERGENCES & TRENDS
- No bullish RSI divergence is present. RSI is making lower lows along with price, but it is near 30 and could produce a short-term bounce.
- Price is below EMA 7 and EMA 21 and below VWAP ($101.85). The EMA 7 / EMA 21 relationship has been bearish for the whole 15-bar window.
- The MACD line crossed below the signal around Nov 5 12:30 and the gap has widened every bar since.
- −DI has been above +DI throughout, and the gap is widening, with +DI falling from 20 to 15.
- CMF fell from +0.65 to -0.23, a clear flip to distribution.
- SMA 50D ($98.93) is far above SMA 200D ($88.91), so the long-term trend is still up. Price at $100.82 is above both, which makes the SMA 50D the next major support, about $1.9 below.
- The chart shows a sequence of lower highs and lower lows in a stair-step decline from about $108 to $100.8.
CHART PATTERNS
- The pattern closest to the reference diagram is a Bearish Flag / Descending channel continuation. After the sharp drop on Nov 3, price rebounded to around $102.5, then rolled over into lower highs and lower lows.
- The wider structure is a staircase of declines with brief consolidations, consistent with a bearish continuation.
- The measured move is limited. The nearest support is the Bollinger lower band near $100.44, then the previous swing low near $100.2, and the SMA 50D near $98.93.
POTENTIAL SCENARIOS
- Scenario 1: Bearish Trend Continuation — Sellers keep control with −DI dominant, MACD widening and price below all short-term averages, so price grinds toward and slightly through the lower Bollinger Band. Trigger: break below $100.44 (lower band). Target: $100.25 to $100.40. Invalidation: reclaim of $101.15 (above EMA 7). (55% probability)
- Scenario 2: Neutral Oversold Bounce / Range — RSI at about 31 prompts a mean-reversion bounce, but price stays capped by EMA 7 and the MACD signal remains negative. Trigger: hold above $100.45 on the open. Target: $100.80 to $101.05. Invalidation: close below $100.40. (30% probability)
- Scenario 3: Bullish Reversal — Dip buyers step in near the lower band and push price back above VWAP. Trigger: break above $101.40 (EMA 21). Target: $101.85 (VWAP). Invalidation: failure to hold $100.80. (15% probability)
PRICE TARGETS
For a 1-day timeframe, the range width should be about 2-4% of the $100.815 price, or roughly $2-4. Given the ATR of $0.29, which is very low, I use the lower end of the guidance, a range of about $2.0 (about 2%).
- Target Price: $100.45 (for the 1-day timeframe)
- Expected Range: $99.75 to $101.60 (width $1.85, about 1.8% of price)
- Key Levels: Support at $100.44, Resistance at $101.38
OVERALL BIAS
OVERALL BIAS: BEARISH - ADX at 31.6 with −DI far above +DI, a widening bearish MACD gap, distribution on CMF and price below all short-term moving averages and VWAP all point lower. The oversold RSI near 31 and the lower Bollinger Band limit the downside, so the move is likely to be modest.
This is educational analysis and not financial advice.