SHEL 3-day bullish forecast — Nov 10, 2026
- Bias: Bullish
- Timeframe: 3 days (made Nov 10, 2026, target date Nov 13, 2026)
- Price at analysis: $97.56
- Price target: $98.00
- Expected range: $96.10 – $99.05
- Result: Correct (+1.5%) — closed at $98.98 on Nov 13, 2026; quality score 100/100
Get a free AI analysis of SHEL today
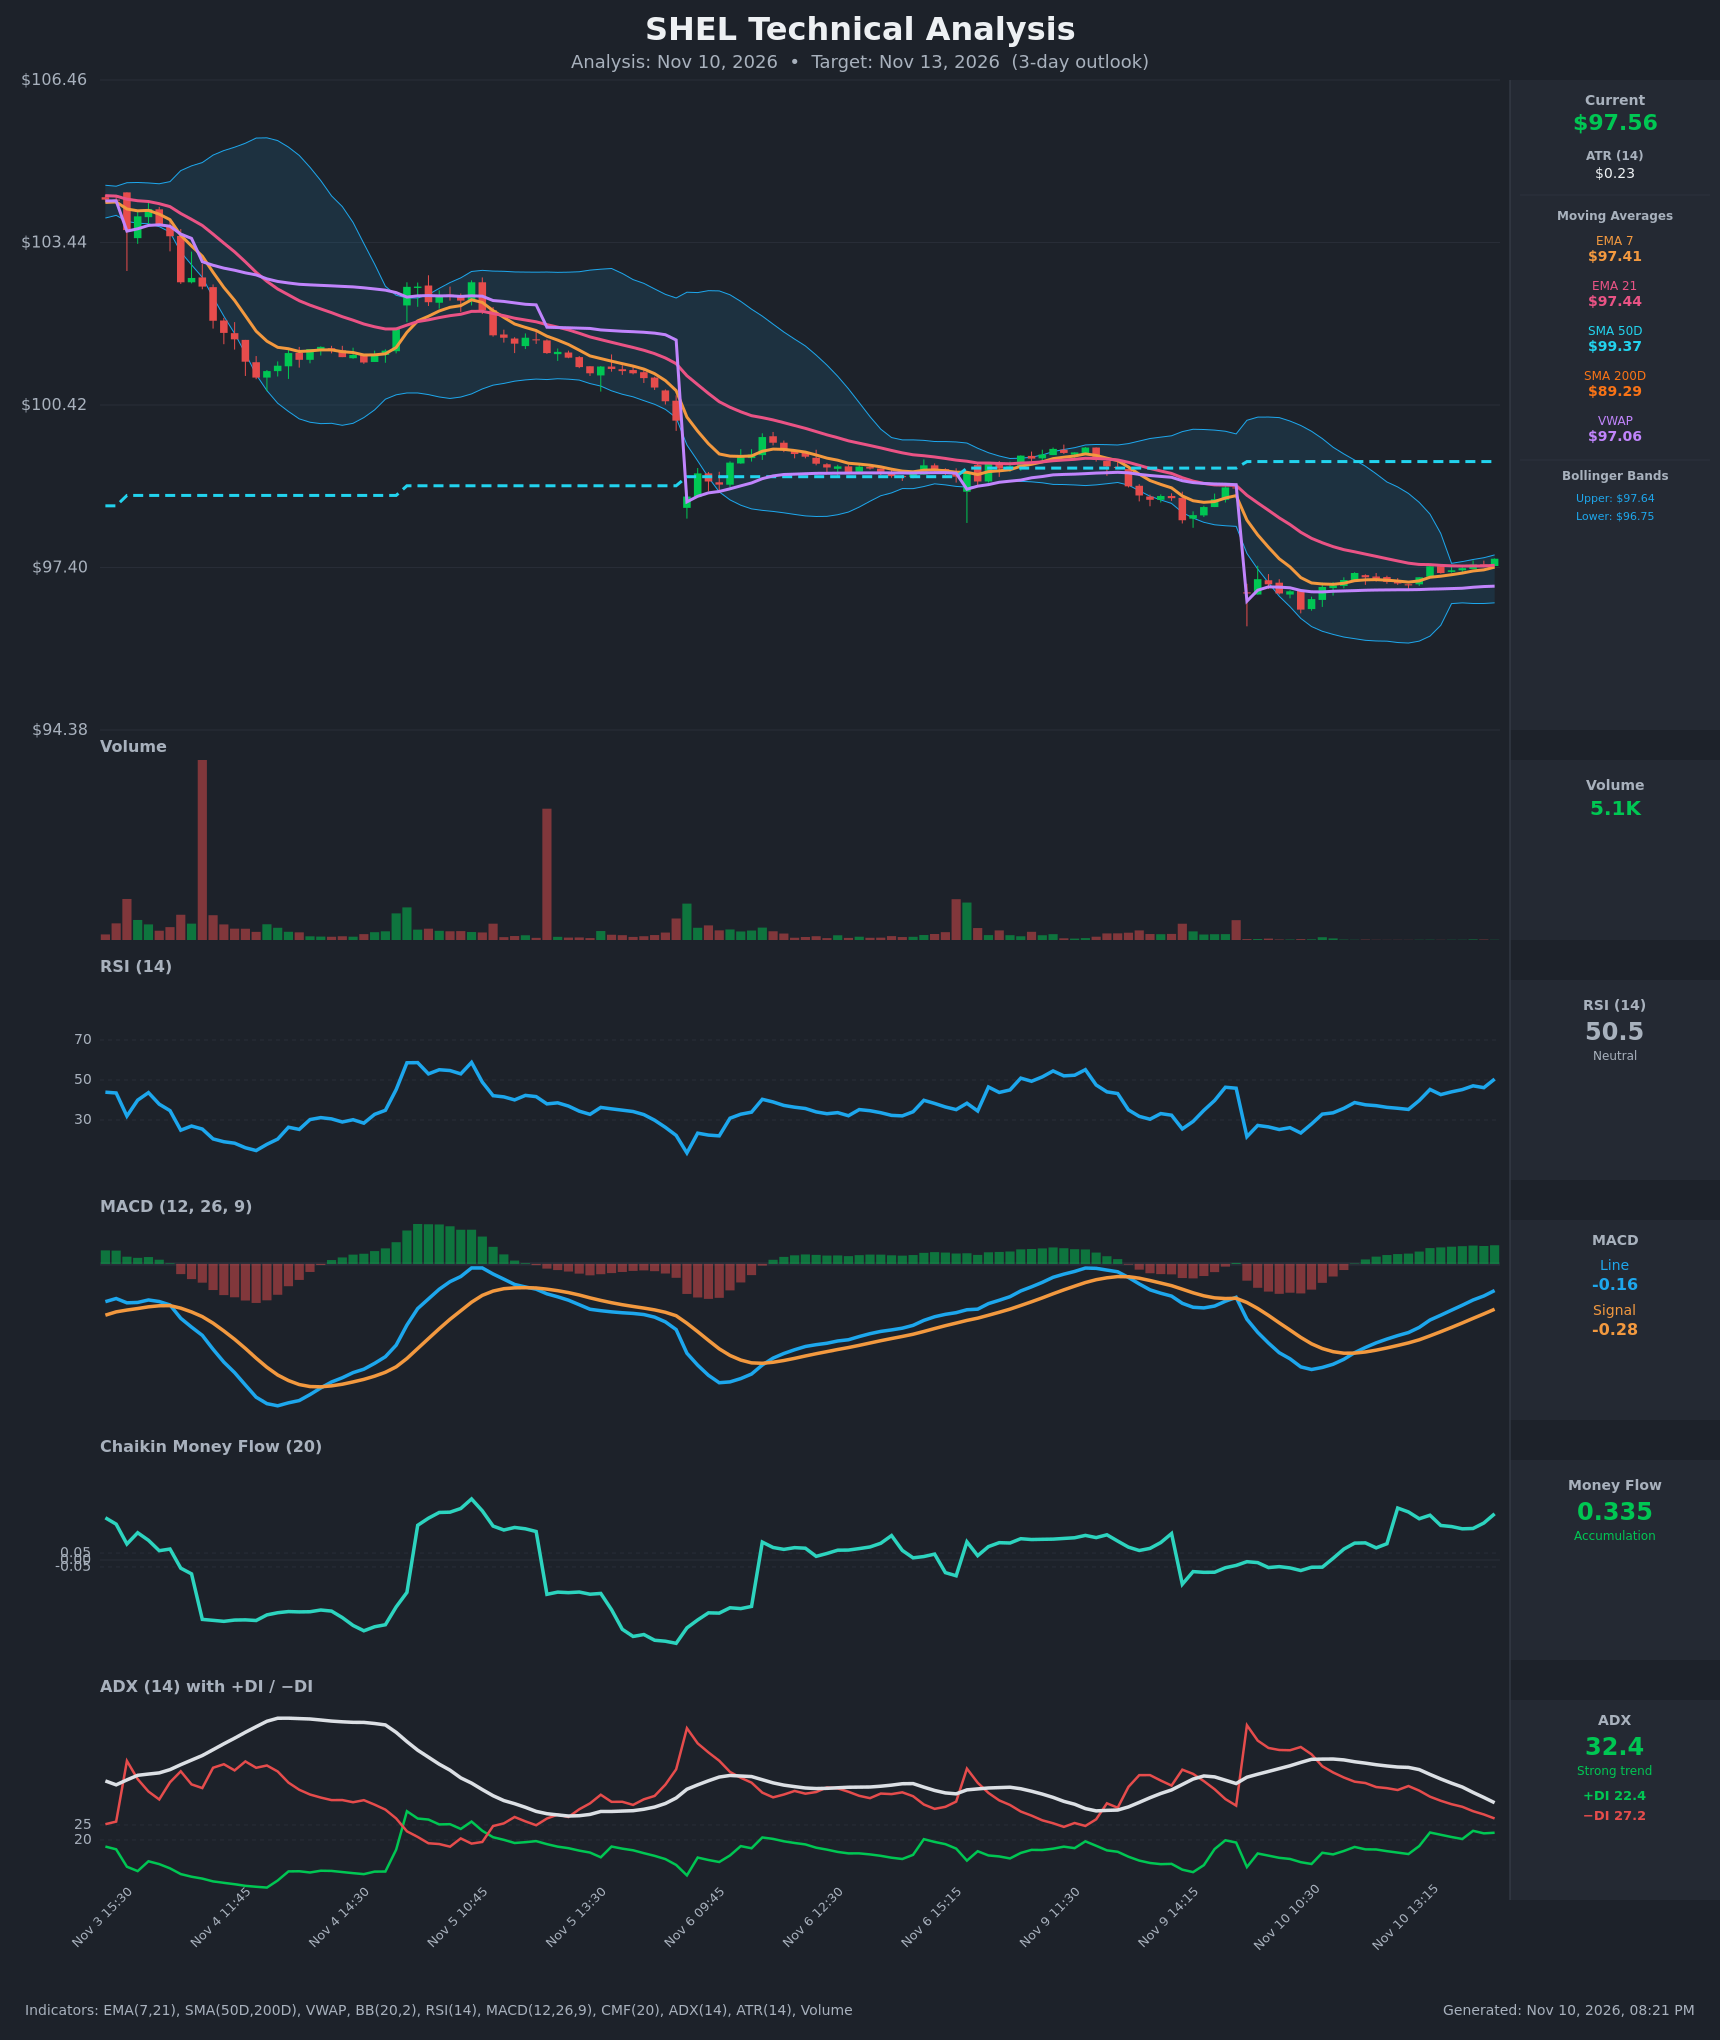
Analysis
TECHNICAL INDICATORS
- RSI (14): 50.46, up from about 35 an hour or two earlier. It has moved from near-oversold to the neutral midline with improving momentum. [Bullish]
- 20 EMA: EMA 21 is $97.44 and EMA 7 is $97.41. Price at $97.565 is above both, so they act as short-term support. EMA 7 is still marginally below EMA 21, so the bullish crossover is not confirmed yet. [Bullish]
- MACD: Line at -0.163, signal at -0.278, histogram positive (+0.115) and widening. A bullish crossover occurred around 12:00 on Nov 10. Both lines are still below zero, so this is a recovery rather than a confirmed uptrend. [Bullish]
- Bollinger Bands (20): Upper $97.64, lower $96.75, so the bands are narrow (about 0.9 wide, roughly 0.9% of price) after contracting from a wide range. Price is pressing the upper band with the middle band near $97.19. A squeeze like this often precedes an expansion, and the upside test favors a breakout attempt. [Bullish]
- CMF (20): 0.335, well above +0.05 and rising since the gap-down. This points to sustained accumulation and buying pressure at the lower levels. [Accumulation]
- ADX (14): 32.4 and falling from the mid-40s, with −DI (27.2) still above +DI (22.4). The prevailing downtrend is strong but fading, and the DI gap has narrowed sharply from about 24 points to about 5. A +DI/−DI bullish crossover is possible if the bounce continues. [Strong but weakening Trend, bearish bias]
- Volume: 5.1K, very light and fading during the recovery. The bounce lacks conviction, although the large selling-volume spikes are also gone. [Neutral / Low participation]
DIVERGENCES & TRENDS
- Trend: The larger structure is a staircase decline. Gap-downs on Nov 5/6, Nov 9/10 and the latest session each reset price lower, and price remains below the SMA50 ($99.37). It stays well above the SMA200 ($89.29), so the long-term trend is intact.
- Momentum: RSI, MACD and CMF are all turning up as price stabilizes around $97.1–$97.6. This is a momentum improvement, not a formal divergence.
- Crossovers: MACD bullish crossover confirmed. EMA 7/EMA 21 is on the verge of crossing up (a gap of only $0.03). The DI lines are converging.
- VWAP: Price ($97.565) is above VWAP ($97.06), showing intraday buyers in control.
- Caution: ADX is still above 25 with −DI on top, and volume is thin, so the bounce could stall at the prior gap area.
CHART PATTERNS
- No fully formed reference pattern is present.
- The recent action is a small base after the gap-down, with higher lows since the Nov 10 low. Compared with the reference diagram, it is closest to a minor bullish flag or falling-wedge-type recovery. The target would be a retest of the gap origin near $98.5–$98.8.
- Zoomed out, the sequence of lower highs and gaps resembles a descending channel. That keeps bearish risk alive if price fails below the upper Bollinger Band and VWAP.
- The narrow Bollinger squeeze implies a breakout of roughly 1–2 ATR-scale moves on the intraday timeframe, which supports a modest upside objective of about $98.
POTENTIAL SCENARIOS
- Scenario 1: Bullish Recovery Toward Gap Fill — MACD, RSI and CMF continue to build, price holds above the EMAs and VWAP, and the squeeze resolves upward. Trigger: sustained break and hold above $97.64 (upper BB) with EMA 7 crossing above EMA 21. Target: $98.00 first, then $98.60. Invalidation: close below $97.06 (VWAP). (50% probability)
- Scenario 2: Bearish Trend Resumption — The bounce fades on low volume, −DI remains dominant and the downtrend continues. Trigger: rejection at $97.64–$97.80 followed by a break below $97.06. Target: $96.75 (lower BB), then $96.20. Invalidation: close above $98.00 on rising volume. (30% probability)
- Scenario 3: Neutral Consolidation — Price chops inside the tight Bollinger range with low volume. Trigger: failure to break either $97.64 or $97.06. Target: $97.20–$97.70. Invalidation: a decisive break beyond either side of that range. (20% probability)
PRICE TARGETS
- Target Price: $98.00 (3-day, Nov 13, 2026)
- Expected Range: $96.10 to $99.05 (width $2.95, about 3.0% of current price, in line with the 2–4% guidance for a 3-day timeframe)
- Key Levels: Support at $97.06, Resistance at $98.60
OVERALL BIAS
OVERALL BIAS: BULLISH - A MACD bullish crossover, RSI recovering to 50, strong CMF accumulation (0.335) and price above VWAP and the short EMAs favor a bounce toward $98. Conviction is modest because ADX/−DI still show a fading downtrend and volume is thin.
This is educational analysis and not financial advice.