SHEL 3-day bullish forecast — Nov 10, 2026
- Bias: Bullish
- Timeframe: 3 days (made Nov 10, 2026, target date Nov 13, 2026)
- Price at analysis: $99.59
- Price target: $100.40
- Expected range: $98.10 – $101.20
- Result: Incorrect (-0.6%) — closed at $98.98 on Nov 13, 2026; quality score 50/100
Get a free AI analysis of SHEL today
Analysis
TECHNICAL INDICATORS
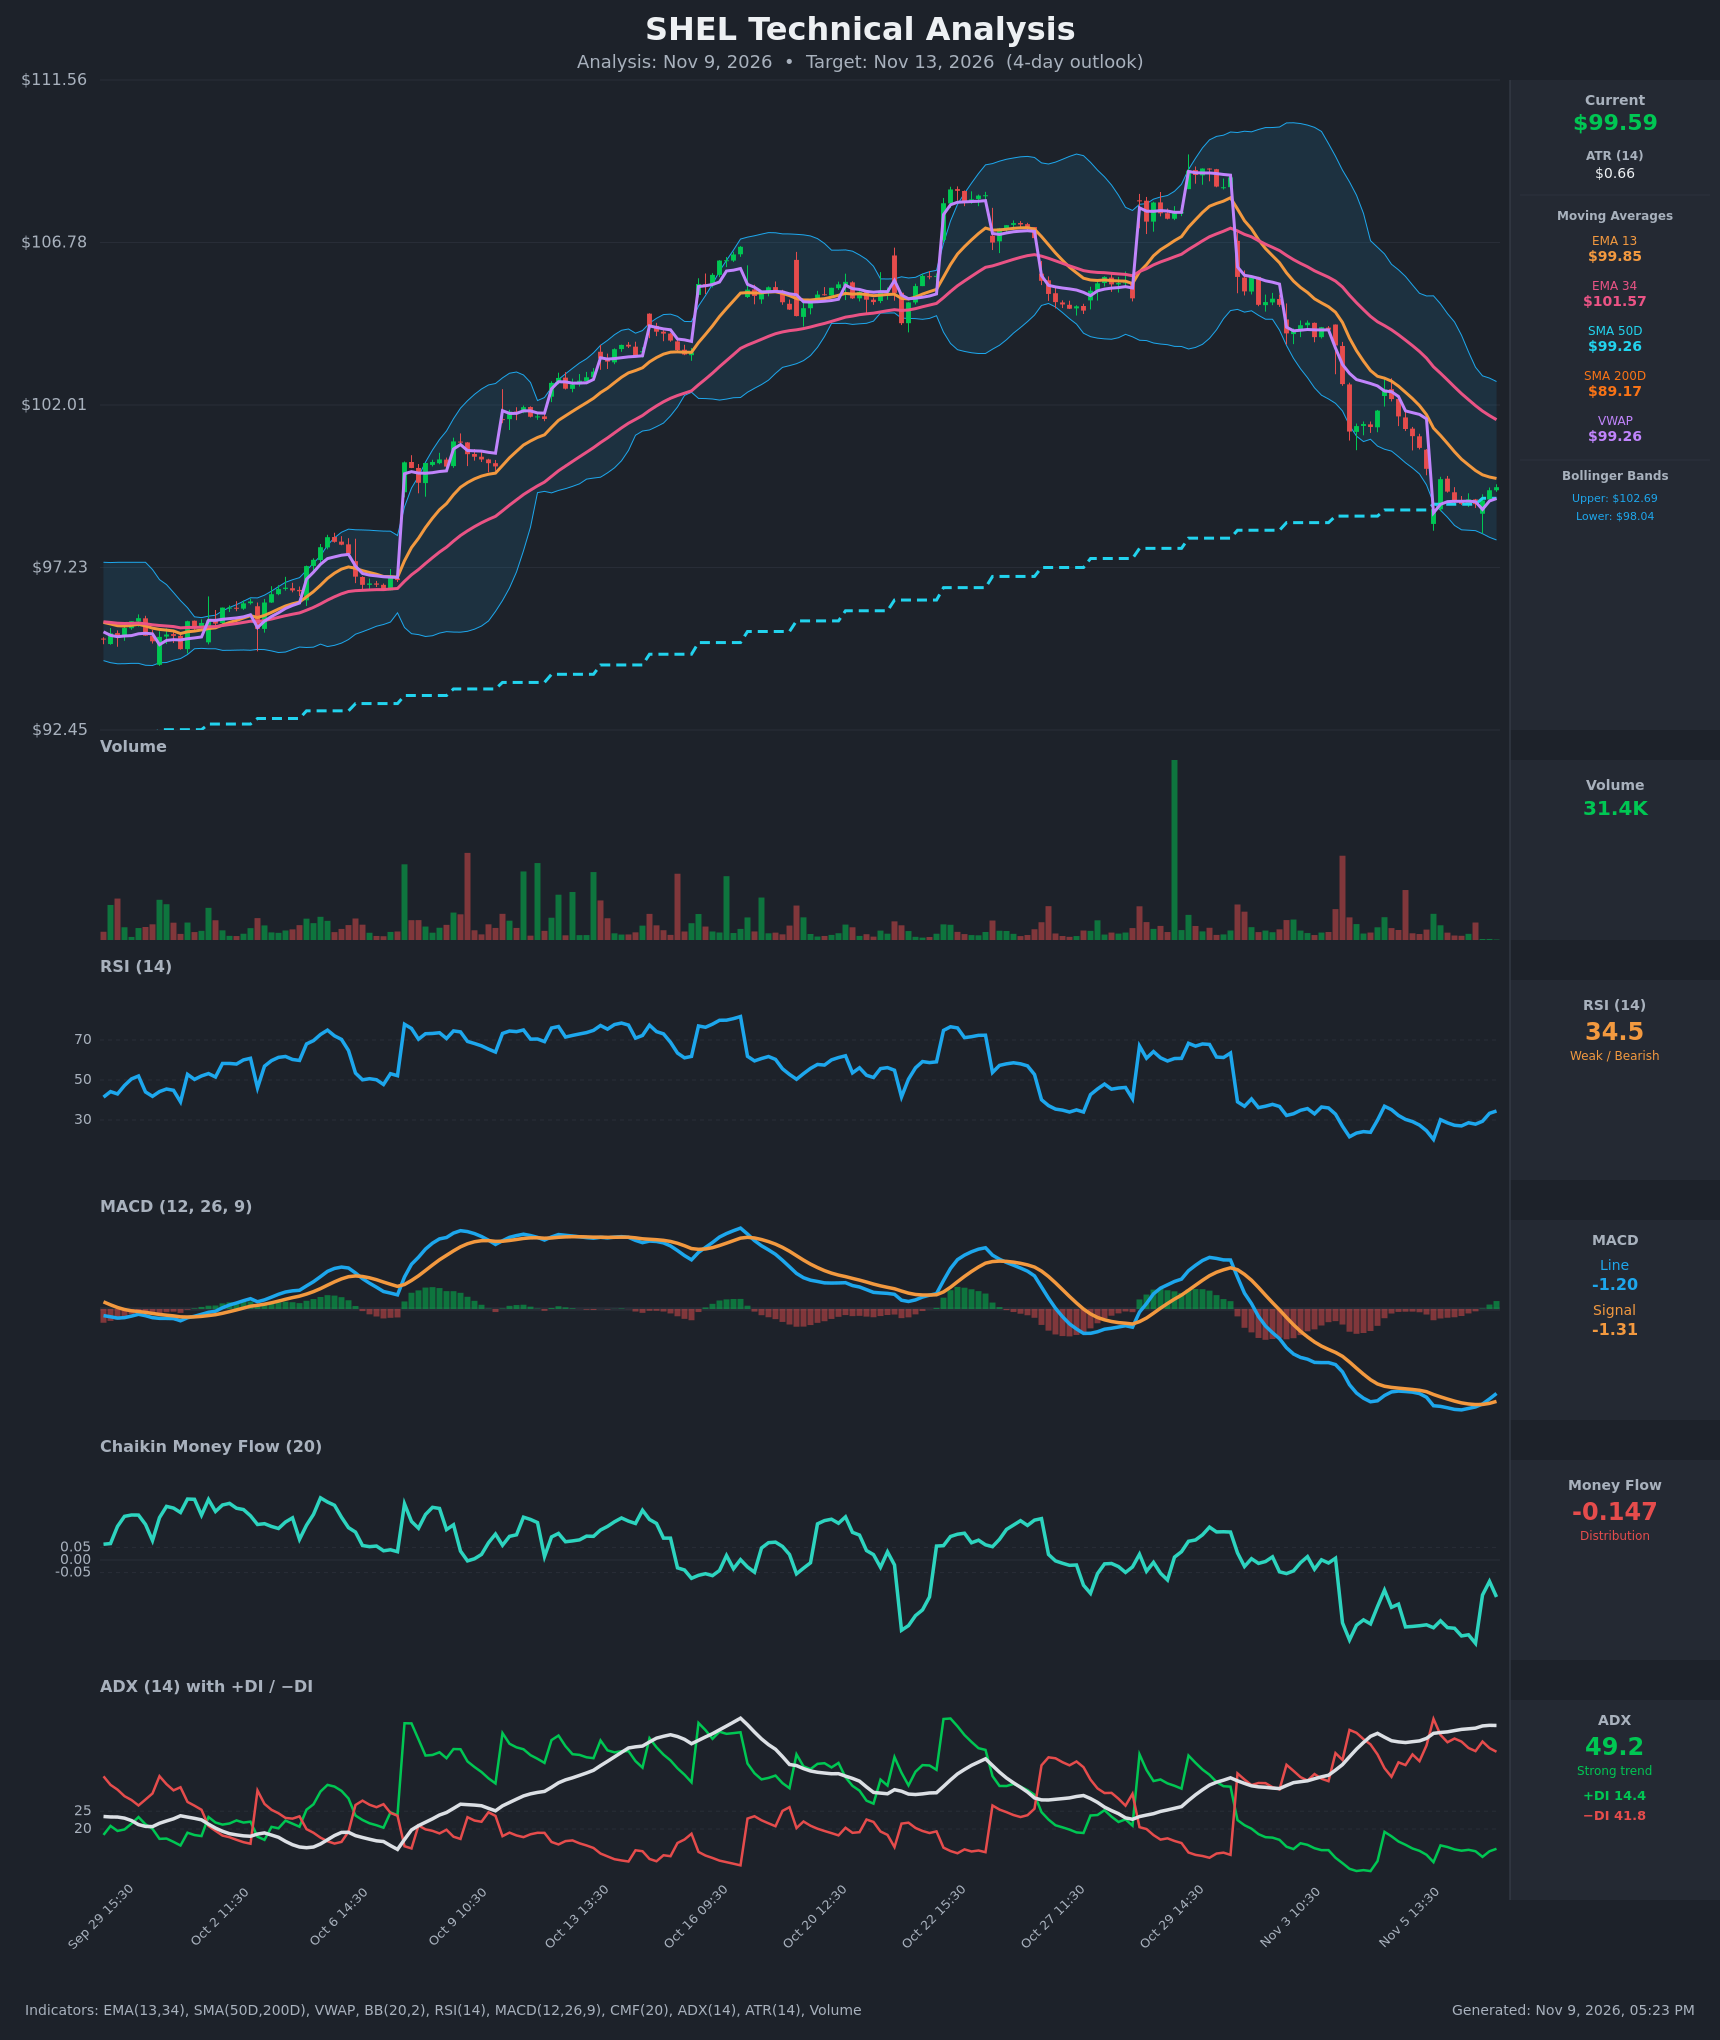
- RSI (14): 34.51, up from a low of 20.3 on Nov 6 and printing higher lows (27 → 29 → 34.5) while price has stabilized near $99. It is still below 50 and in bearish territory, but it is no longer oversold and momentum is turning up. [Neutral]
- 20 EMA (EMA 13/34 used): EMA13 is $99.85 and EMA34 is $101.57. Price at $99.59 sits just under EMA13 and well under EMA34. The EMA13 < EMA34 bearish alignment is intact, but EMA13 is flattening and the gap to price has shrunk to about $0.26. EMA13 is the first resistance and EMA34 is the major overhead hurdle. [Bearish]
- MACD: The line is -1.199 and the signal is -1.312. The line crossed above the signal on Nov 9 and the histogram has flipped positive, rising for four straight bars. It is a bullish crossover, but it is occurring deep below zero, so it signals a relief bounce rather than a trend change. [Bullish]
- Bollinger Bands (20): The bands are $98.04 to $102.69 and price is in the lower third, about $1.55 above the lower band. Price walked the lower band down and has now stopped making new lows. The wide bands show elevated volatility, and the middle band (~$100.36) is a natural bounce target. [Neutral]
- CMF (20): -0.147, well below -0.05, so selling pressure dominates. It has improved from -0.33 to -0.15 over the last few bars, which suggests selling is easing, but it is still firmly negative. [Distribution]
- ADX (14): 49.2 with −DI at 41.8 and +DI at 14.4. This is a very strong downtrend with sellers firmly on top. ADX at ~49 and flat is a stretched, mature reading, and trends this extended often pause or mean-revert. +DI is ticking up and −DI is easing. [Strong Trend – Bearish]
- Volume: 31.4K, light, with no capitulation spike during the decline and no strong buying surge on the bounce. The low-volume stabilization means the bounce lacks conviction. [Neutral / Weak confirmation]
Other levels: price is slightly above the SMA50D ($99.26) and VWAP ($99.26), which gives a cluster of nearby support. It remains far above the SMA200D ($89.17), so the long-term trend is still up and the SMA50D is well above the SMA200D with no death cross.
DIVERGENCES & TRENDS
- Mild bullish divergence: RSI made a low of 20.3 at $98.94 on Nov 6, and the current RSI of 34.5 is well above that with price higher. MACD momentum is also improving, with its histogram turning positive while price has stopped falling.
- Trend still bearish: EMA13 < EMA34, price is below both, −DI is far above +DI, and CMF is negative. The decline from ~$105 to ~$99 is steep and orderly.
- Crossovers: MACD bullish crossover (Nov 9). There is no EMA13/EMA34 bullish crossover, and the gap is still ~$1.73. +DI/−DI have not crossed.
- Confluence: Price is holding on the SMA50D/VWAP cluster at ~$99.26 after tagging the lower Bollinger Band area, which marks a short-term inflection zone.
CHART PATTERNS
- Descending channel / small consolidation after a sharp drop: Price has chopped sideways in about $98.94–$100.00 for two sessions after a sharp markdown. This resembles a Bearish Pennant/Flag (continuation, bearish) if $98.94 breaks. A Bullish Falling Wedge-type reversal is possible if price breaks up through the EMA13 and the descending highs.
- No textbook pattern is confirmed. The base is only a few bars old, and a measured move would be small, about $1–1.5 in either direction.
- Break above ~$100.20 would target EMA34/mid-band around $101.00–$101.57. Break below $98.94 would target the lower band and ~$97.50.
POTENTIAL SCENARIOS
- Scenario 1: Bullish Relief Bounce to the Mid-Band — Oversold RSI, MACD bullish crossover, and the SMA50D/VWAP support cluster fuel a mean-reversion bounce as the extended ADX pauses. Trigger: hold above $99.26 and a close above EMA13 ($99.85) and then $100.20. Target: $100.40–$101.20, with the mid-band and EMA34 ($101.57) as the extension. Invalidation: a close below $98.94. (45% probability)
- Scenario 2: Bearish Trend Continuation — The dominant downtrend resumes, with −DI far above +DI, negative CMF, and price below EMA34. The bounce fails at EMA13/VWAP and rolls over like a bearish pennant. Trigger: rejection at $99.85–$100.20 and a break below $98.94. Target: $98.04 (lower BB), then $97.50. Invalidation: a close above $100.60. (40% probability)
- Scenario 3: Neutral Chop — Price stays pinned between $98.90 and $100.20 as the market digests the drop on light volume. Trigger: no break of either boundary. Target: about $99.50. Invalidation: a decisive break either way. (15% probability)
PRICE TARGETS
For a 3-day horizon, the range width is calibrated to about 3.1% of price: ($101.20 − $98.10) / $99.59 ≈ 3.1%, with the target $0.81 above the current price. The ATR of $0.66 per hour supports a range of this size over about 3 days.
- Target Price: $100.40 (3-day)
- Expected Range: $98.10 to $101.20
- Key Levels: Support at $99.26 (SMA50D/VWAP; next $98.04 lower BB), Resistance at $101.57 (EMA34; first hurdle at EMA13 $99.85)
OVERALL BIAS
OVERALL BIAS: BULLISH - Price is holding the SMA50D/VWAP support cluster with a bullish MACD crossover, RSI higher lows, and an extremely extended ADX that favors a relief bounce toward the mid-band (~$100.40). Conviction is modest, since the trend, EMA alignment, and CMF remain bearish and a break below $98.94 would invalidate the call.
This is educational analysis and not financial advice.