RGTI 6-day bullish forecast — Nov 8, 2026
- Bias: Bullish
- Timeframe: 6 days (made Nov 8, 2026, target date Nov 13, 2026)
- Price at analysis: $11.74
- Price target: $11.95
- Expected range: $11.35 – $12.15
- Result: Incorrect (-18.8%) — closed at $9.53 on Nov 13, 2026; quality score 0/100
Get a free AI analysis of RGTI today
Analysis
TECHNICAL INDICATORS
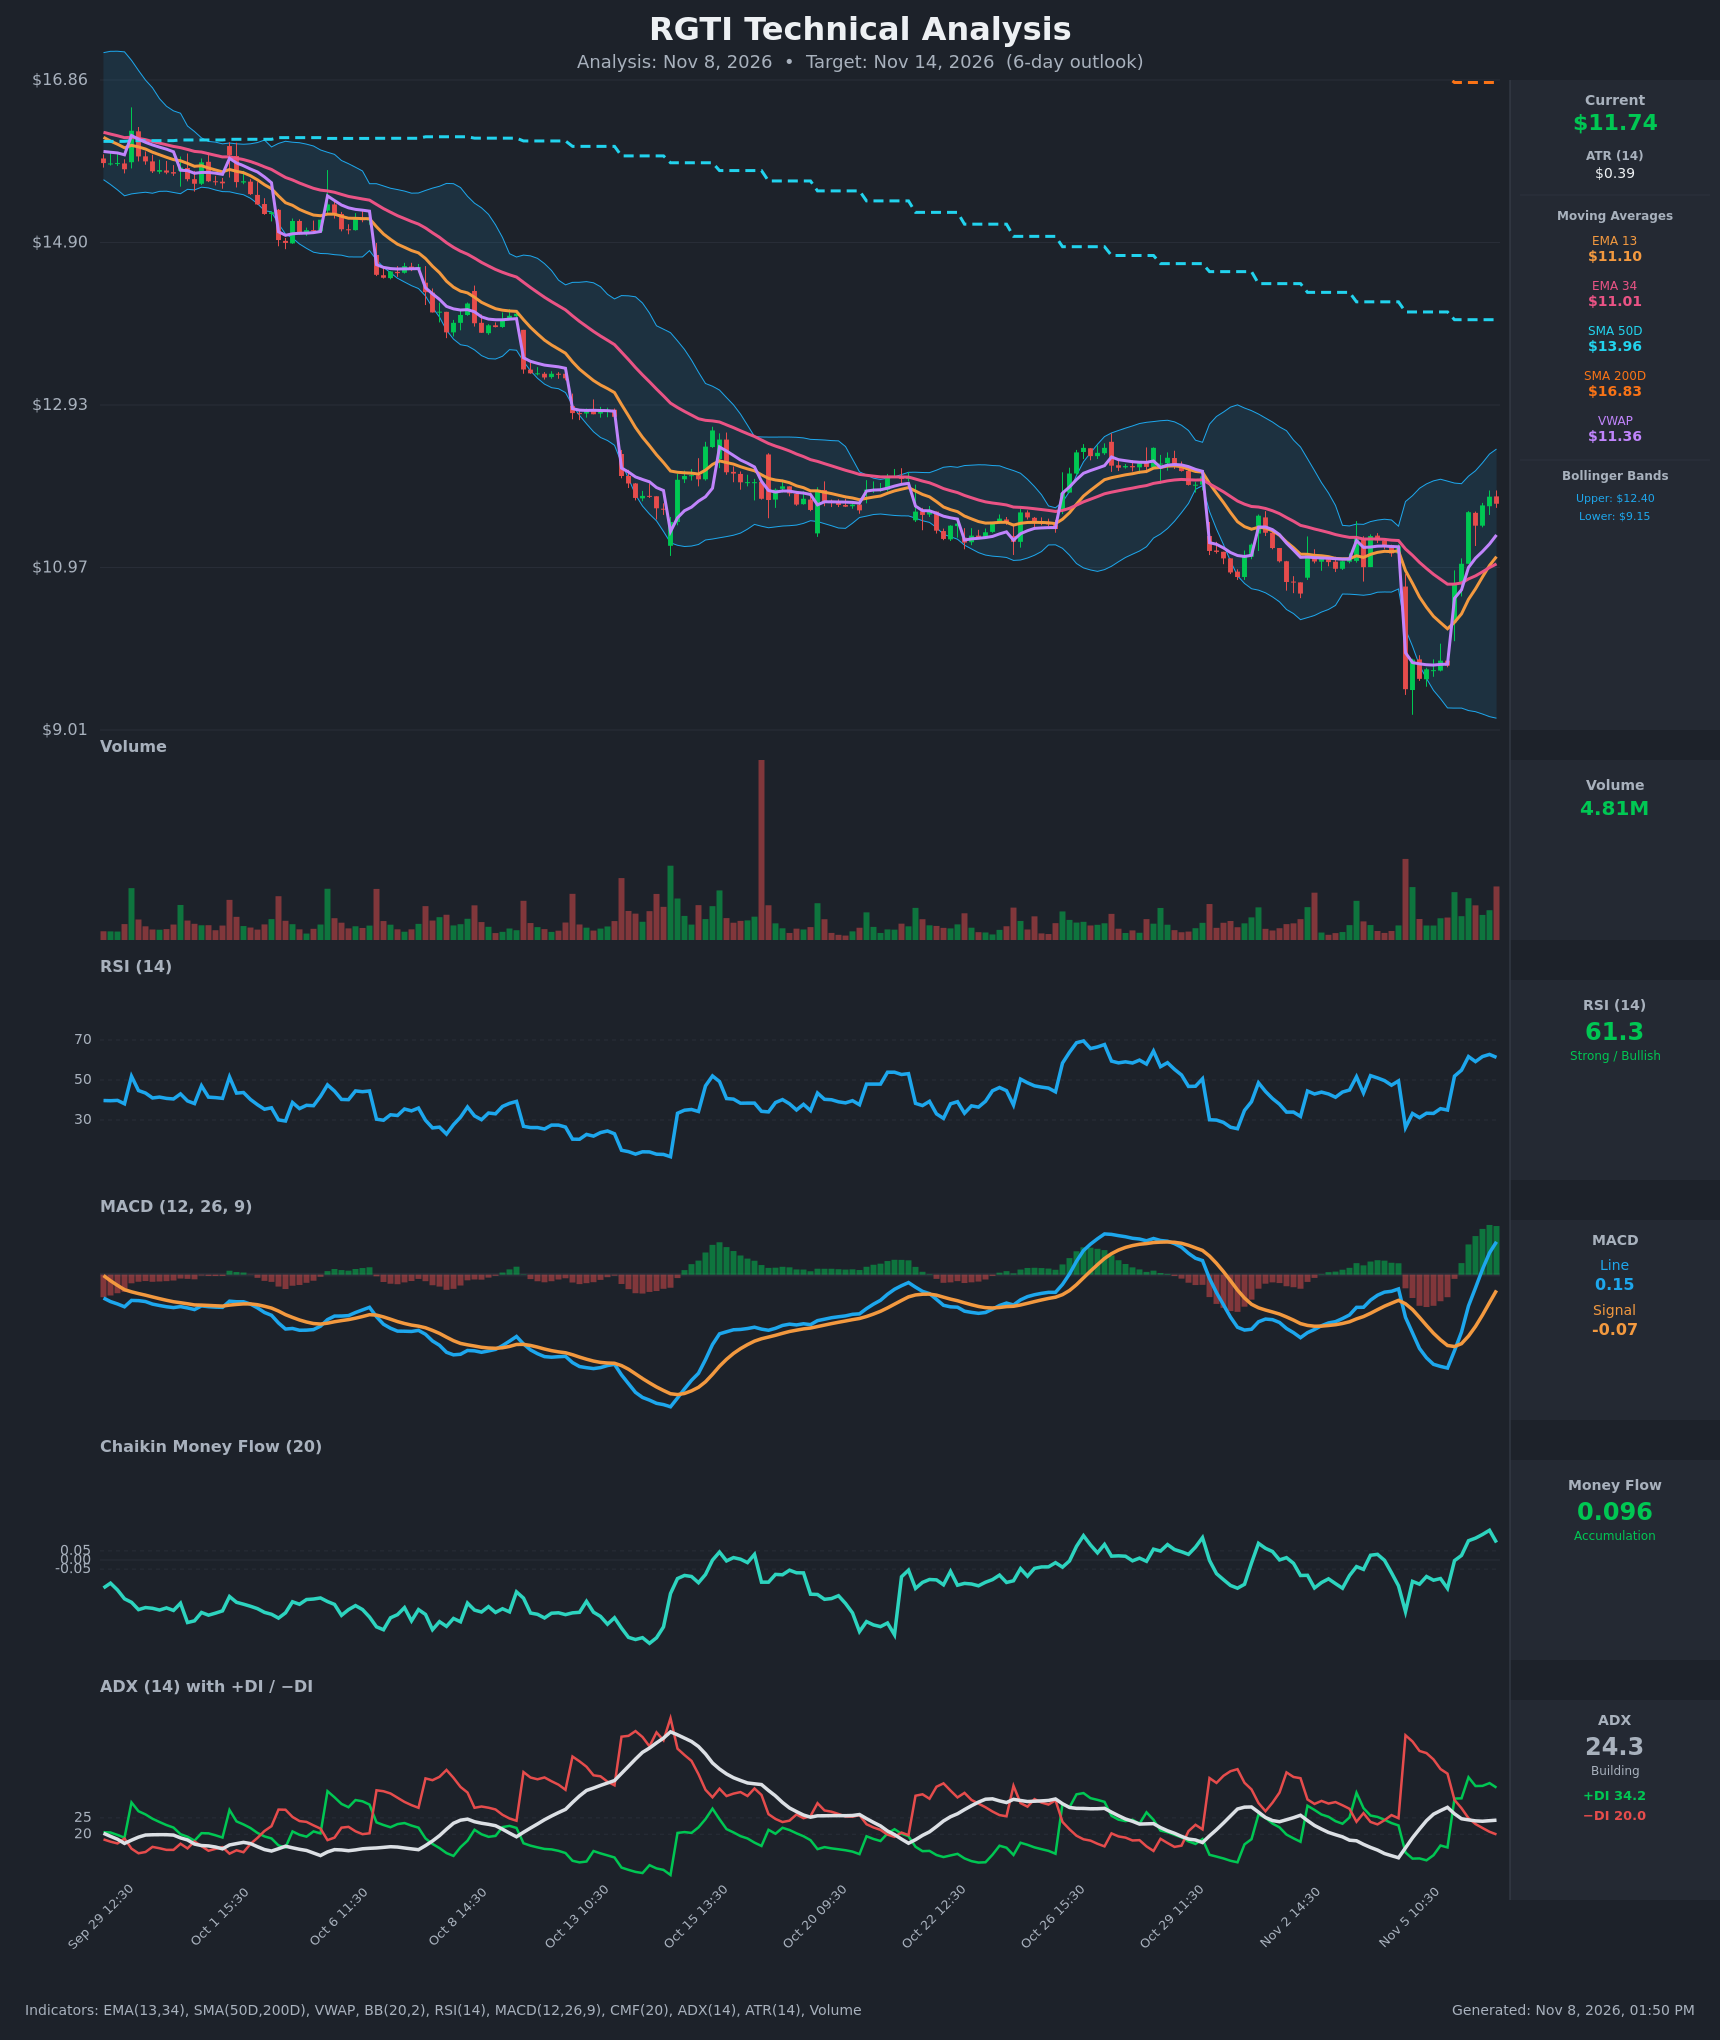
- RSI (14): 61.30, up from 26.2 on Nov 5 and 35 at the Nov 5 close. Momentum is strong and rising, with room before the 70 overbought line. [Bullish]
- 20 EMA: The chart uses EMA 13 ($11.10) and EMA 34 ($11.01). Price at $11.74 is about 5.8% above EMA 13. EMA 13 has just crossed above EMA 34, a fresh short-term bullish crossover, and both averages are now acting as support. [Bullish]
- MACD: The line (0.149) crossed above the signal (-0.071) on Nov 6 around 13:30 and the histogram is positive and expanding. The cross happened from below zero and the line has just moved above zero. [Bullish]
- Bollinger Bands (20): Upper $12.40, lower $9.15, so the bands are very wide after the Nov 5 capitulation. Price is in the upper half, about 0.8 of the band width from the lower band. The midline (about $10.78) is well below. Upside room to the upper band is about $0.66, and the wide bands signal elevated volatility. [Bullish]
- CMF (20): 0.096, above the +0.05 threshold and turning positive on Nov 6 after weeks of negative readings. It peaked at 0.163 and has eased slightly, which points to accumulation. [Accumulation]
- ADX (14): 24.3, rising and just under the 25 trend-strength line. +DI (34.2) is well above −DI (20.0), after a bullish DI crossover on Nov 6 at the open. Bulls are in control, but the trend is not yet confirmed as strong. [Building Trend – Bullish]
- Volume: 4.81M on the latest bar, with green volume bars dominating the recovery after the Nov 5 spike. This is healthy participation on the rally but not a blow-off surge. [Moderately Bullish]
Other context: price is above VWAP ($11.36), which supports buyers. It is still far below SMA50D ($13.96) and SMA200D ($16.83). The 50D remains below the 200D, so there is no golden cross and the death-cross structure persists.
DIVERGENCES & TRENDS
- No clear bearish price/indicator divergence. RSI, MACD and CMF all rose in step with price.
- On the daily scale there was a prior bullish divergence: RSI made a higher low (the Nov 5 low of about 26 versus the Nov 4 reading of about 49) while the capitulation spike was quickly bought.
- Momentum has turned decisively. MACD crossed bullishly, EMA 13 crossed above EMA 34, +DI crossed above −DI, and CMF moved into positive territory.
- The long-term trend is still down: lower highs since September, and the SMA50D and SMA200D keep declining. This is a counter-trend relief rally into declining resistance, so the rally is vulnerable to fading.
- The recent bounce is steep (about +23% off the $9.50 low in 2 sessions). Short-term pullbacks or consolidation are likely as price approaches the upper Bollinger Band.
CHART PATTERNS
- No clean textbook pattern. The best fit is a V-shaped reversal after a gap-down capitulation at $9.50 (failed breakdown / bear trap). Before that, price spent about 2 weeks in a $10.90–$12.40 range.
- It loosely resembles the Bullish Falling Wedge / Expanding Triangle reversals in the diagram, since price made lower highs and lows through the long decline and has now broken out of the shorter downtrend.
- Reclaiming the former range mid-to-upper area ($11.50–$12.20) is constructive. The range-high zone of about $12.2–$12.4 (the Oct 29 highs and upper Bollinger Band) is the key overhead resistance and a measured-move area.
- If the reversal fails, a Bearish Pennant / Flag in a longer downtrend is the alternative reading, with a break back below $11.10 targeting $10.30–$9.50.
POTENTIAL SCENARIOS
- Scenario 1: Bullish Momentum Continuation — Price holds above VWAP and the EMA 13/34 cluster and grinds toward the prior range high and upper Bollinger Band. Trigger: hold above $11.36 and close above $11.90. Target: $12.15–$12.40. Invalidation: close below $11.10 (EMA 13). (50% probability)
- Scenario 2: Bearish Rejection / Fade of Relief Rally — Price stalls near $12 under the declining long-term trend, MACD flattens and price drops back through VWAP and the EMAs. Trigger: failure at $12.0–$12.4 and a break below $11.36. Target: $10.70–$11.00. Invalidation: close above $12.45. (30% probability)
- Scenario 3: Neutral Consolidation — Price digests the 23% bounce in a tight band above the EMAs. Trigger: low-volume chop between $11.30 and $12.10. Target: about $11.70. Invalidation: a break of either end of the band on volume. (20% probability)
PRICE TARGETS
Range width check: $12.15 − $11.35 = $0.80, which is about 6.8% of $11.74. That is appropriate for a 6-day horizon (between the 2–3 day and 7–10 day guidance).
- Target Price: $11.95 (6 days)
- Expected Range: $11.35 to $12.15
- Key Levels: Support at $11.36 (VWAP; EMA 13 at $11.10 is the next layer), Resistance at $12.40 (upper Bollinger Band and prior range high)
OVERALL BIAS
OVERALL BIAS: BULLISH - MACD, EMA 13/34, +DI/−DI and CMF all turned bullish with price above VWAP and RSI at 61 with room to run. The bias is modest, because the stock remains well below its declining SMA50D/SMA200D and is facing overhead resistance near $12.2–$12.4.
This is educational analysis and not financial advice.