RGTI 4-day bullish forecast — Nov 8, 2026
- Bias: Bullish
- Timeframe: 4 days (made Nov 8, 2026, target date Nov 11, 2026)
- Price at analysis: $11.74
- Price target: $11.95
- Expected range: $11.45 – $12.05
- Result: Incorrect (-6.0%) — closed at $11.03 on Nov 11, 2026; quality score 0/100
Get a free AI analysis of RGTI today
Analysis
TECHNICAL INDICATORS
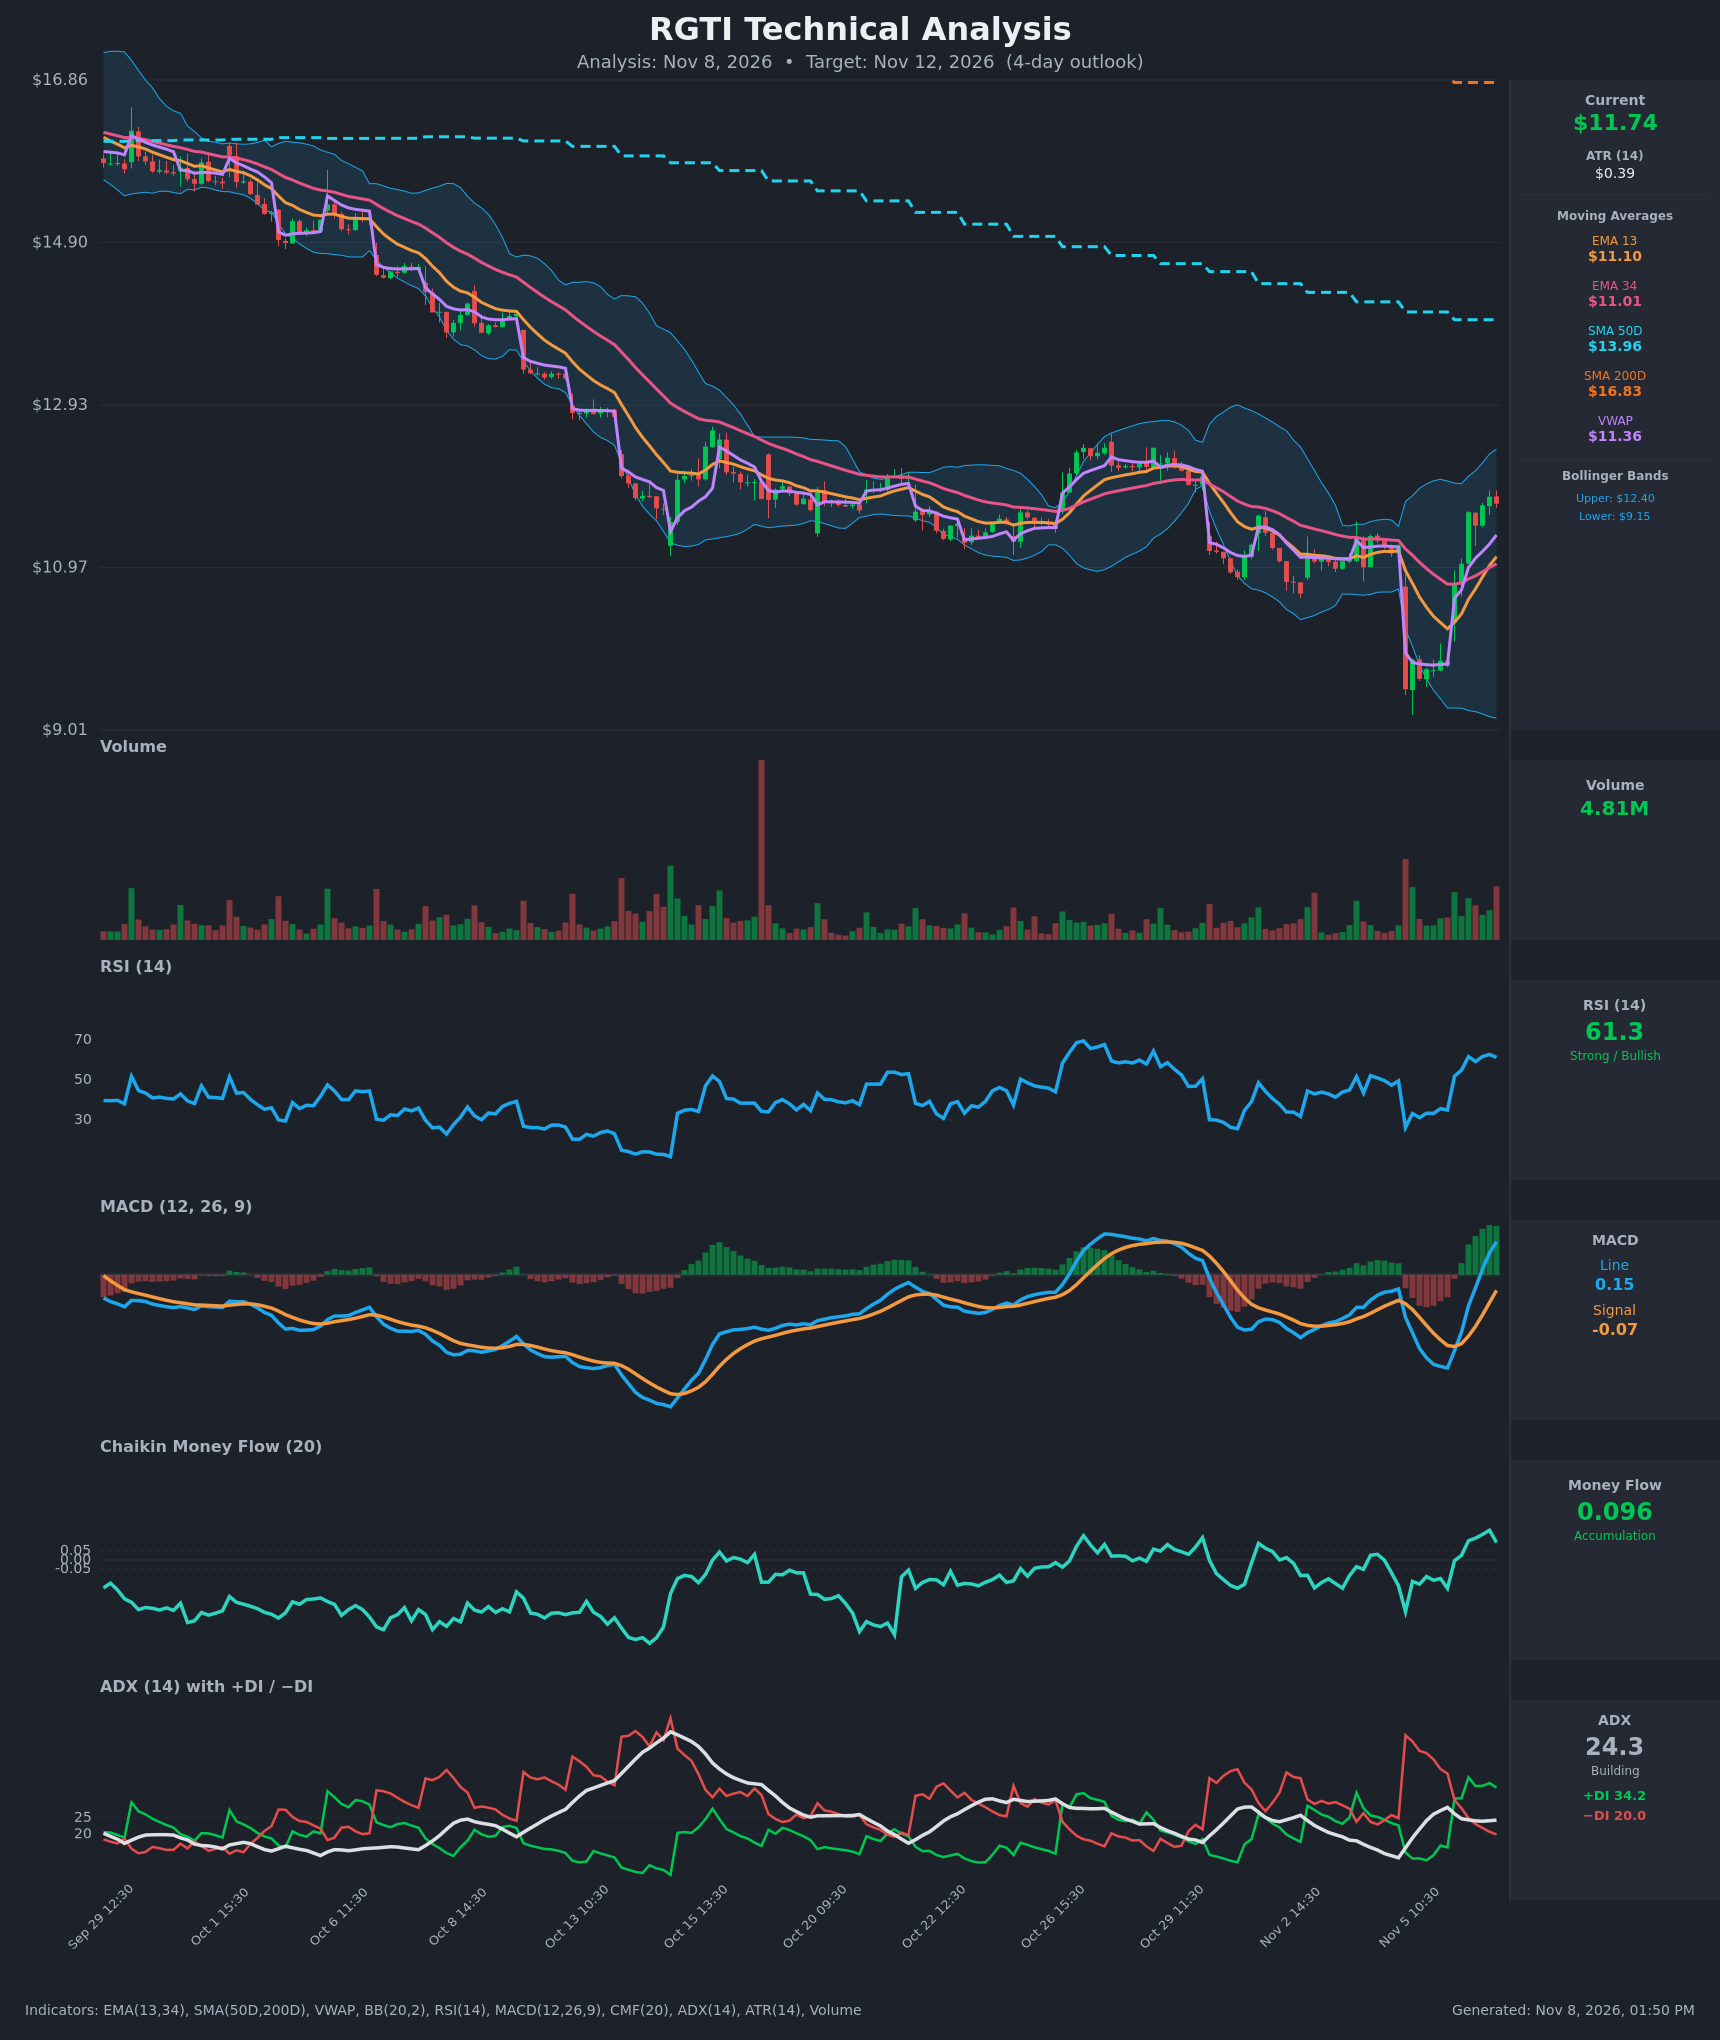
- RSI (14): 61.30, up from the 26-35 zone on Nov 5. It is climbing toward but not yet at overbought (70), so there is room to run. Momentum is rising but has flattened over the last three bars (62.8 → 61.3). [Bullish]
- 20 EMA: The chart supplies EMA 13 at $11.10 and EMA 34 at $11.01. Price at $11.74 is above both, and EMA13 has crossed above EMA34 (around Nov 6 14:30). The averages are turning up from a long downtrend, and the EMA13 area (~$11.10) is the first dynamic support. [Bullish]
- MACD: The line (0.149) crossed above the signal (-0.071) around Nov 6 13:30, and the histogram has flipped positive and is expanding. The crossover is still below the zero line on a longer view, so it is an early-stage recovery signal. [Bullish]
- Bollinger Bands (20): Upper $12.40, lower $9.15, so the bands are very wide after the Nov 5 flush. Price at $11.74 sits in the upper half, above the midline (~$10.78), with about $0.66 of room to the upper band. The bands are starting to widen upward, which is consistent with an expansion leg. [Bullish]
- CMF (20): 0.096, above the +0.05 threshold and off a recent peak near 0.16. Accumulation has been sustained since Nov 6, though the last reading ticked down. [Accumulation]
- ADX (14): 24.3, just under the 25 trend threshold and flat (it has been in a 24-28 range). +DI at 34.2 is well above −DI at 20.0, so bulls are in control. The trend is not yet confirmed strong, but direction favors the upside. [Weak-to-Moderate Trend, Bullish direction]
- Volume: 4.81M, with the last few green bars on above-average volume as price rebounded from $9.50. The recovery is volume-supported, but there is no climactic surge. The Nov 5 capitulation bar had heavy volume and was absorbed. [Mildly Bullish confirmation]
DIVERGENCES & TRENDS
- There is no clear price/indicator divergence. RSI, MACD and CMF all made higher lows alongside the Nov 5 low and are now confirming the price bounce.
- Price is above VWAP ($11.36) and both short EMAs, and the +DI/−DI crossover on Nov 6 morning shows buyers took control.
- The larger picture is still bearish. Price is below SMA50 ($13.96) and SMA200 ($16.83), and SMA50 is far below SMA200 (a death cross already in place and still falling). The rebound is a counter-trend recovery inside a larger downtrend.
- RSI and CMF have flattened over the last 1-2 bars, which hints at short-term consolidation after a +23% bounce in two sessions.
- ADX is below 25, so trend conviction is not yet there. The bounce could stall near the upper Bollinger Band or the mid-$12s.
CHART PATTERNS
- Broader structure: Price has been in a long descending channel (Sep to Nov), roughly a Bullish Falling Wedge shape. The Nov 5 flush to $9.50 and immediate recovery above the old $11 base looks like a failed breakdown and a V-shaped reversal.
- Short-term: The move from $11.0 to $11.74 is a sharp impulse. A shallow Bullish Flag/Pennant consolidation would favor a push toward the $12.40 upper band, with a measured upside of roughly $12.3-12.5.
- Caveat: The pattern is not fully confirmed. A reclaim of the previous range highs near $12.0-12.4 is needed, and the SMA50 at ~$13.96 remains a major overhead hurdle.
POTENTIAL SCENARIOS
- Scenario 1: Bullish Continuation Toward Upper Band — Price holds above VWAP/EMA13 and extends the recovery as MACD and +DI stay supportive. Trigger: break and hold above $12.00 on solid volume. Target: $12.30-$12.40 (upper Bollinger Band). Invalidation: close below $11.10 (EMA13). (50% probability)
- Scenario 2: Neutral Consolidation — After the sharp bounce, price digests gains between VWAP and the mid-$12s as ADX stays below 25. Trigger: failure to clear $12.00 with fading volume. Target: $11.35-$11.95 range. Invalidation: decisive break above $12.40 or below $11.00. (28% probability)
- Scenario 3: Bearish Failed Bounce — The counter-trend rally fades under the long-term downtrend, filling the gap and revisiting the EMAs. Trigger: close below $11.36 (VWAP) and then $11.10 (EMA13/34). Target: $10.60-$10.90. Invalidation: reclaim of $11.90 on volume. (22% probability)
PRICE TARGETS
- Target Price: $11.95 (4-day, Nov 12, 2026)
- Expected Range: $11.45 to $12.05 (width $0.60, about 5.1% of the current price, appropriate for a 4-day horizon)
- Key Levels: Support at $11.36 (VWAP; secondary at $11.10 EMA13), Resistance at $12.40 (upper Bollinger Band)
OVERALL BIAS
OVERALL BIAS: BULLISH - Fresh MACD bullish crossover, +DI well above −DI, positive CMF accumulation, and price above VWAP and the EMAs. The long-term downtrend (below SMA50 and SMA200) and a sub-25 ADX cap conviction and limit upside to roughly the upper Bollinger Band.
This is educational analysis and not financial advice.