RGTI 13-day bullish forecast — Nov 8, 2026
- Bias: Bullish
- Timeframe: 13 days (made Nov 8, 2026, target date Nov 20, 2026)
- Price at analysis: $11.73
- Price target: $12.10
- Expected range: $11.10 – $12.35
- Result: Pending — graded after the close on Nov 20, 2026
Get a free AI analysis of RGTI today
Analysis
TECHNICAL INDICATORS
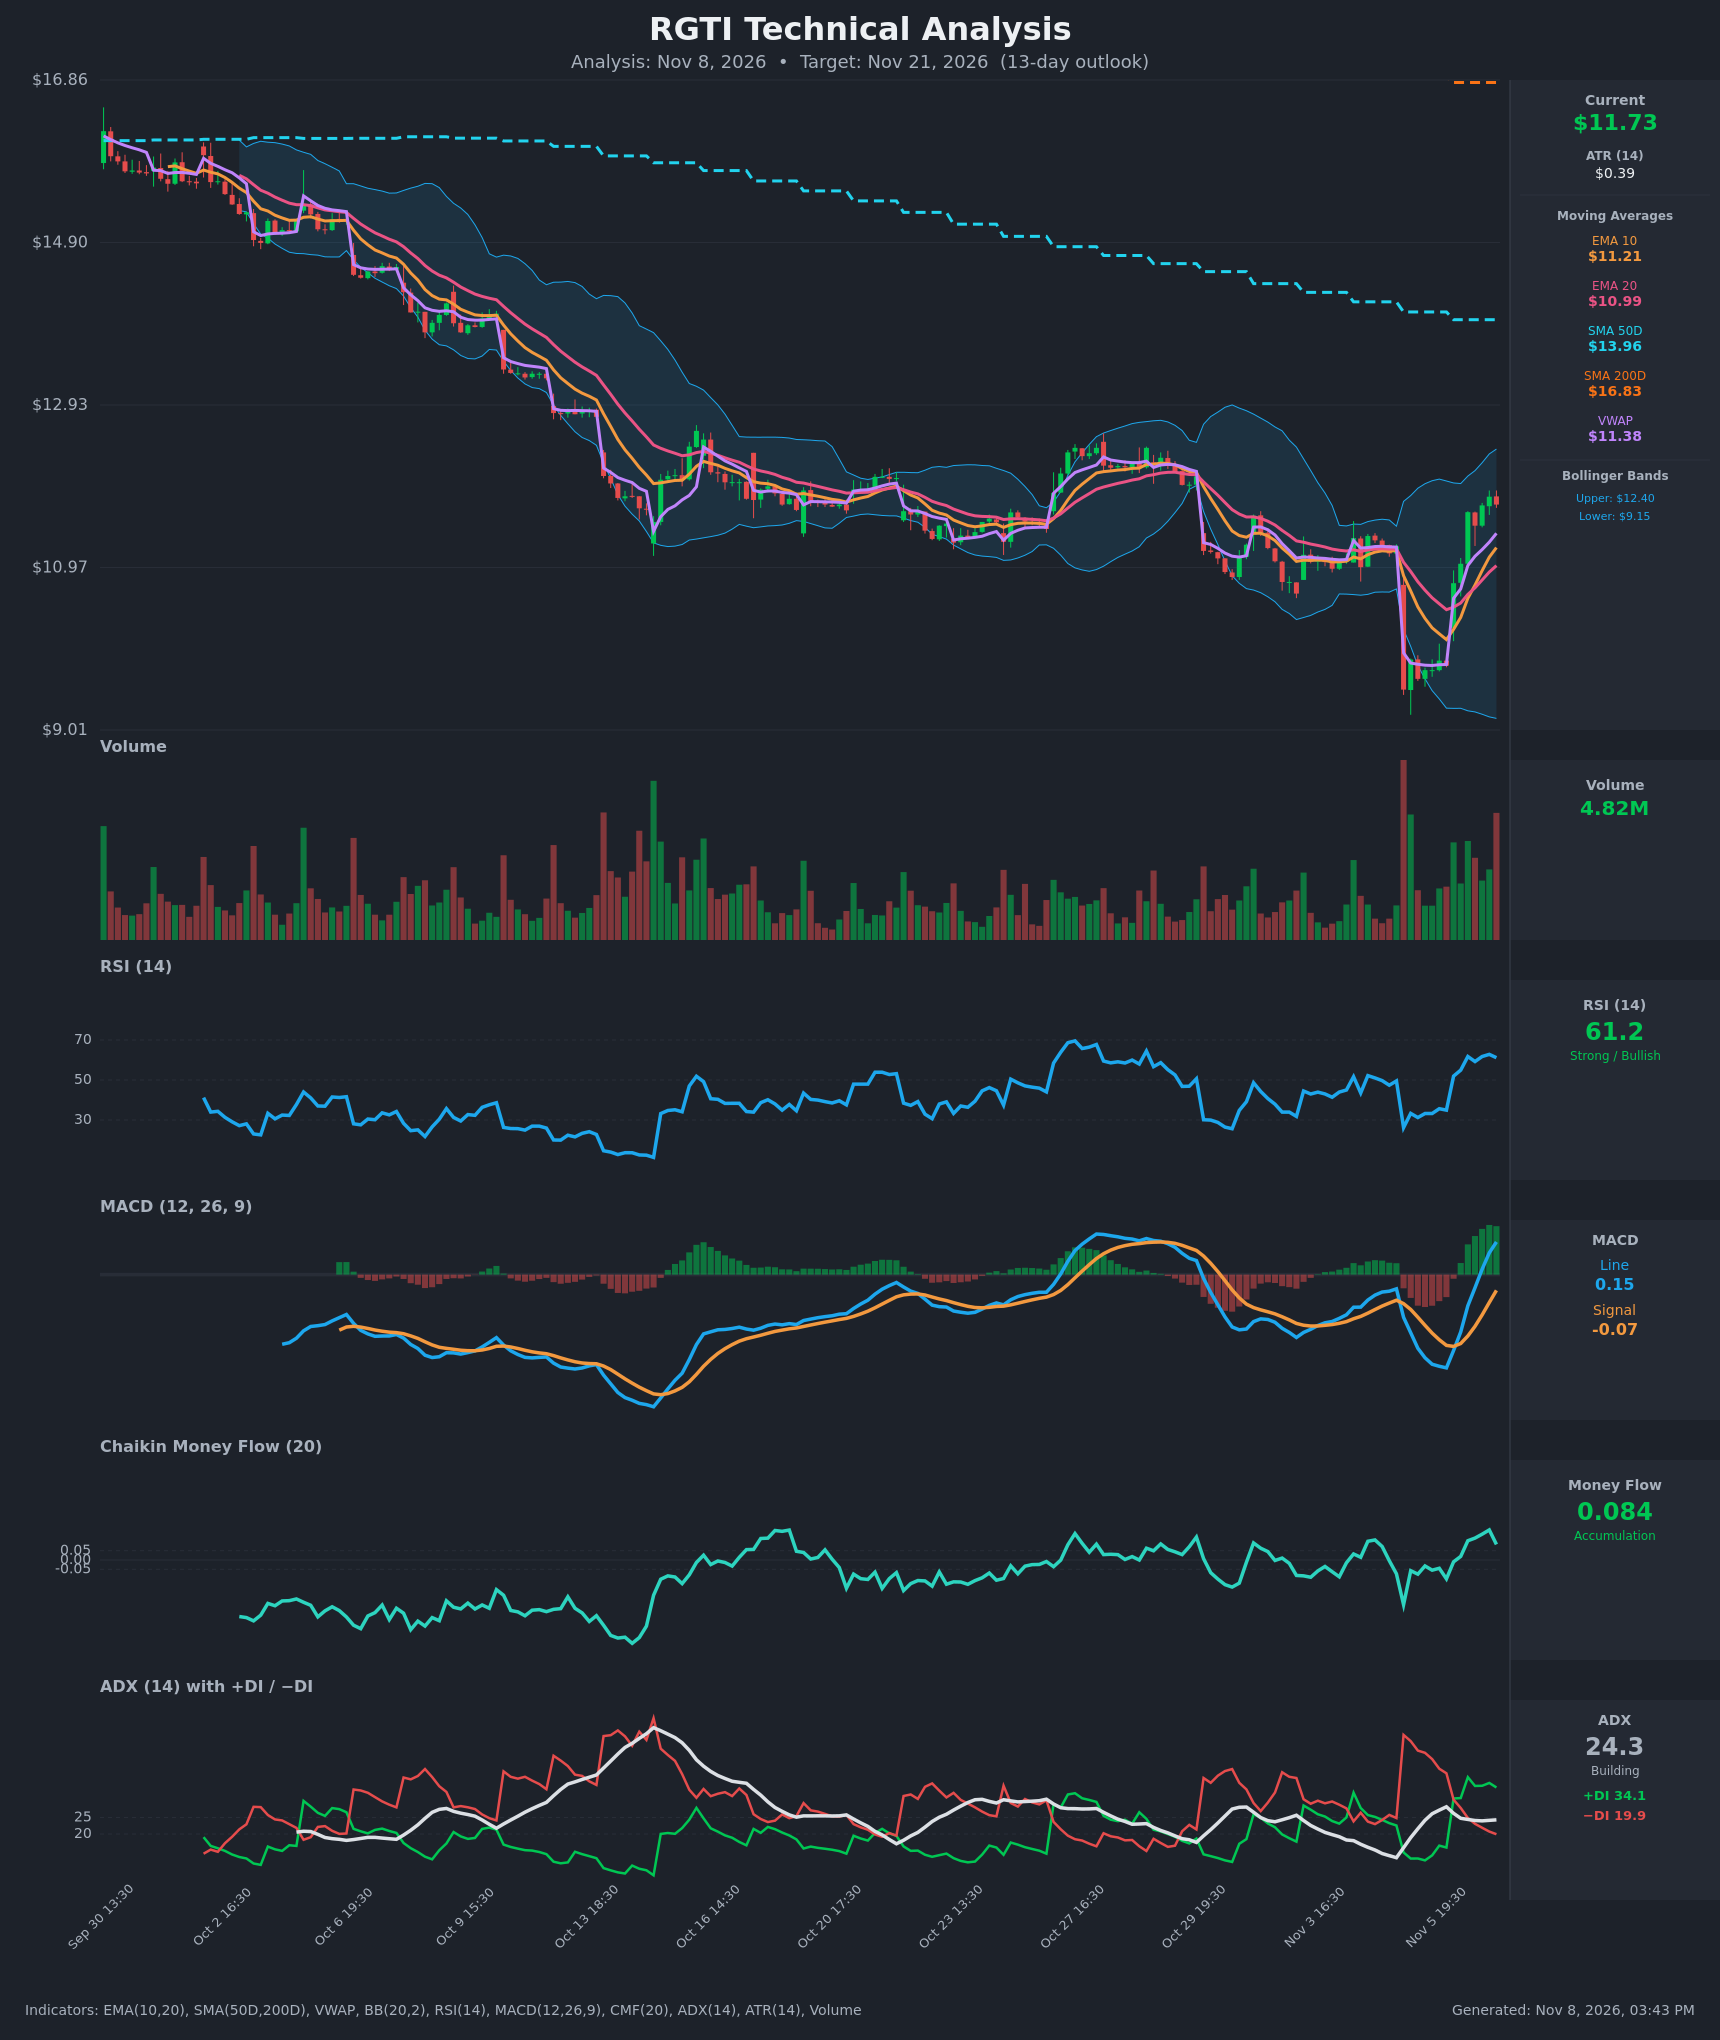
- RSI (14): 61.15, up from 26 on Nov 5 and below the 70 overbought line. Momentum has turned sharply higher, with room to run before overbought. [Bullish]
- 20 EMA: $10.99, with price ($11.73) about 6.7% above it. EMA10 ($11.21) crossed above EMA20 during the Nov 6 session, which is a fresh bullish crossover. Both are now rising and act as support. [Bullish]
- MACD: Line 0.148 vs Signal -0.071, so the line crossed above the signal on Nov 6 (-0.059 to +0.025). The histogram has flipped positive and is expanding. This is a clean bullish momentum shift from a deeply negative reading of -0.42. [Bullish]
- Bollinger Bands (20): Upper $12.40, lower $9.15, and the bands are wide after the Nov 5 gap-down. Price is in the upper half of the bands, about $0.67 below the upper band. The 20-period midline sits near $10.77, so price is riding above it. The lower band is distorted by the spike low, so the upper band near $12.40 is the relevant near-term cap. [Bullish]
- CMF (20): +0.084, above the +0.05 threshold and positive for the last 6 bars (0.019 to 0.161). That points to accumulation, though it has slipped from the 0.161 peak. [Accumulation]
- ADX (14): 24.3, just below 25 and flat, so the trend is moderate and building. +DI (34.1) is well above −DI (19.9), and the DIs crossed bullishly on Nov 6. Bulls control the short-term move, but the ADX has not confirmed a strong trend yet. [Moderate Trend, Bullish direction]
- Volume: 4.82M on the latest bar, which is elevated and among the heaviest recent sessions. The rally from $9.49 came on heavy volume, which supports real buying. The final bar was a small pullback on high volume, a mild sign of supply near $11.80. [Supportive of rebound, minor caution]
DIVERGENCES & TRENDS
- No bearish RSI or MACD divergence. Both indicators rose with price, so the rebound is confirmed by momentum.
- MACD crossed bullishly from below zero and has now moved above zero (0.148). That is a stronger signal than a crossover that stays below zero.
- Moving averages: Price is above EMA10, EMA20 and VWAP ($11.38), all short-term bullish. Price is still far below SMA50 ($13.96) and SMA200 ($16.83), and SMA50 is below SMA200. The death-cross structure is already in place, so the long-term trend remains bearish. Both long averages are still declining.
- Trend contrast: The short-term trend is a sharp V-shaped recovery inside a larger multi-week downtrend (lower highs since $16+ on Sep 30). Counter-trend rallies in such structures often stall at prior resistance.
- CMF and ADX: CMF stayed positive through the entire bounce, so accumulation is confirmed. The ADX is hovering at 24-25, so a close above 25 with +DI above −DI would confirm a trend.
CHART PATTERNS
- Range with a failed breakdown (Triple Bottom / Double Bottom reference): Price consolidated in about $10.9-$12.5 from Oct 16 to Nov 4. It broke down to $9.49 on Nov 5, then reclaimed the range within a day. This bear-trap recovery resembles a bullish double-bottom reversal, with a measured target at the range top of about $12.40-$12.50.
- Larger context (Bearish Rising Wedge and Descending Triangle reference): The overall decline from $16+ has lower highs, and SMA50 and SMA200 are both sloping down. The bounce is therefore a counter-trend move until price clears about $12.50 and then $13.
- Targets: The pattern-based target is the range top at $12.40-$12.50. A break above it opens $13.00 and then the SMA50 near $13.90. A failure to hold $11.20 risks a retest of $10.60-$10.99.
POTENTIAL SCENARIOS
- Scenario 1: Bullish Continuation to Range Top — The MACD cross, DI control, positive CMF and reclaimed range support drive price to test the $12.40 upper Bollinger Band and prior range top. Trigger: hold above EMA10 (~$11.20) and close above $12.00 on rising volume. Target: $12.30-$12.50, with a stretch to $13.00 on a breakout. Invalidation: daily close below $10.99 (EMA20). (50% probability)
- Scenario 2: Bearish Rejection at Resistance — The bounce fades at the $12.40-$12.50 prior supply zone, below the falling SMA50. The long-term downtrend reasserts itself and price gives back the gains. Trigger: failure at $12.40 with RSI turning down from near 70 and a MACD histogram roll-over. Target: $10.60-$11.00 (EMA20 and VWAP area). Invalidation: close above $12.60 on strong volume. (30% probability)
- Scenario 3: Neutral Consolidation — Price chops between EMA10 support and the upper band, digesting the V-shaped rally. Trigger: ADX stays below 25 and volume fades. Target: $11.20-$12.20. Invalidation: close outside $10.90-$12.50. (20% probability)
PRICE TARGETS
- Target Price: $12.10 (13-day horizon)
- Expected Range: $11.10 to $12.35 (width $1.25, about 10.7% of the current price, in line with the 8-12% guide for a roughly 2-week horizon)
- Key Levels: Support at $11.20, Resistance at $12.40
OVERALL BIAS
OVERALL BIAS: BULLISH - The MACD crossover, +DI dominance, positive CMF and reclaimed range support point to further upside toward the $12.40 range top. The gains are likely capped near there by the falling SMA50 and SMA200 and the broader downtrend, so conviction is modest.
This is educational analysis and not financial advice.