RGTI 20-day bullish forecast — Nov 8, 2026
- Bias: Bullish
- Timeframe: 20 days (made Nov 8, 2026, target date Nov 27, 2026)
- Price at analysis: $11.75
- Price target: $12.15
- Expected range: $10.95 – $12.35
- Result: Pending — graded after the close on Nov 27, 2026
Get a free AI analysis of RGTI today
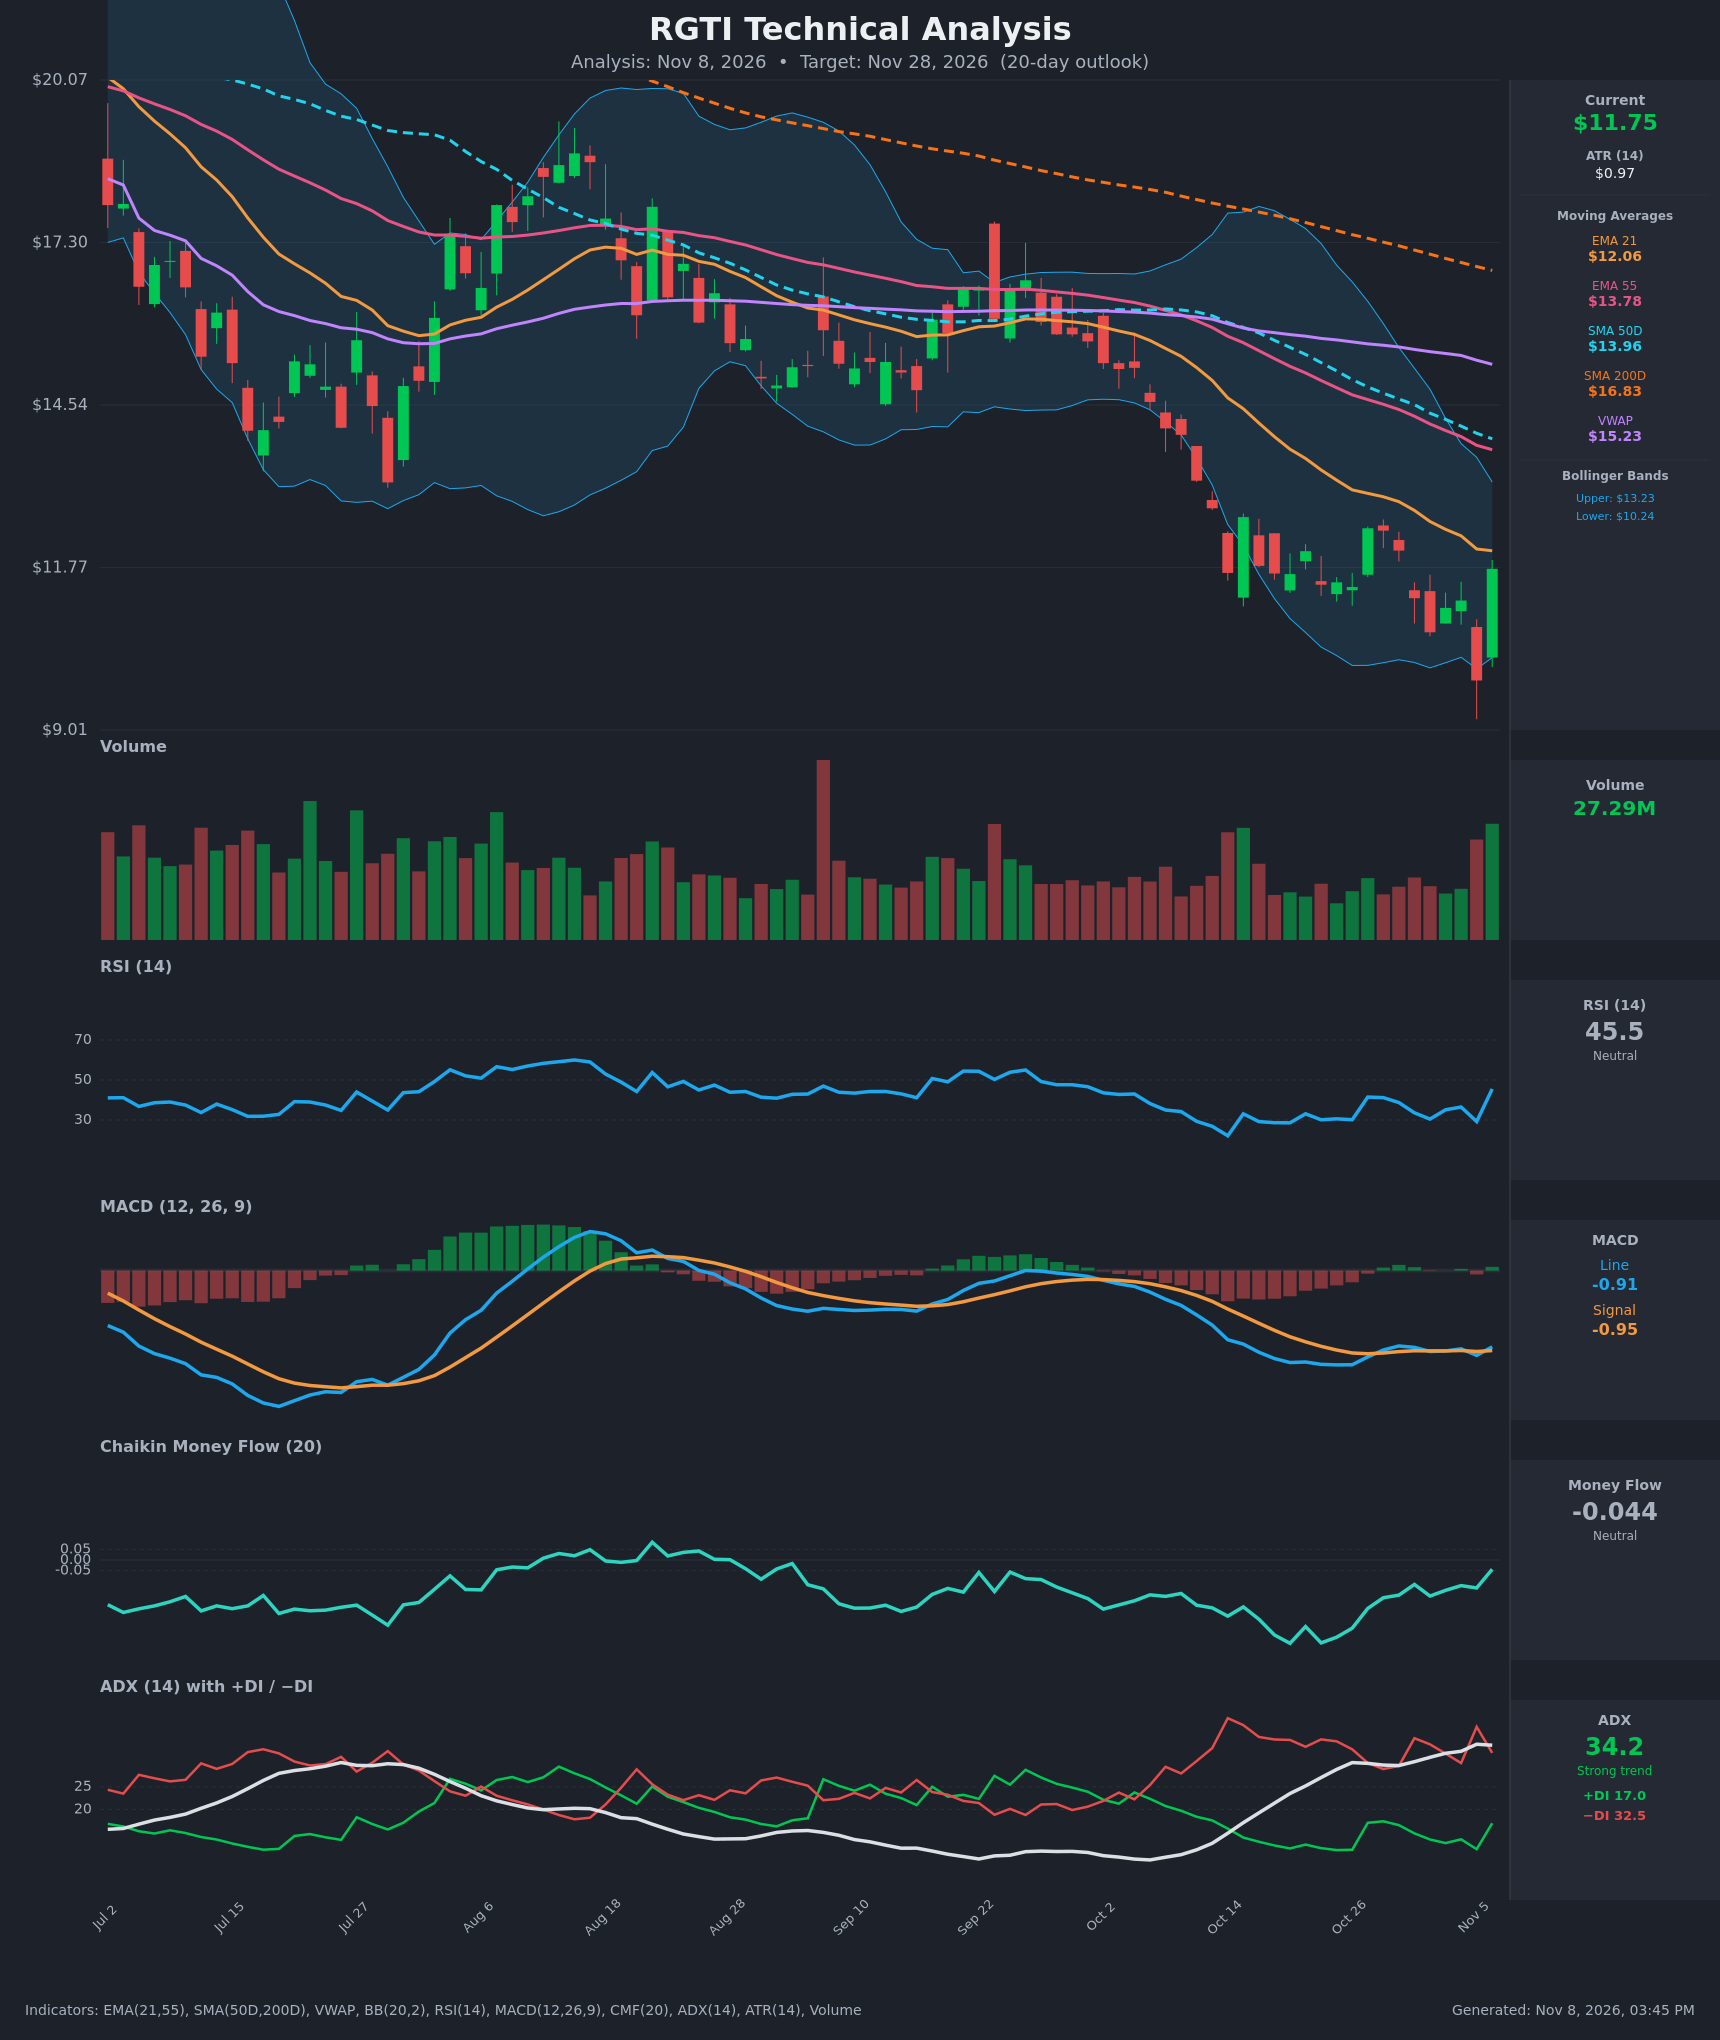
Analysis
TECHNICAL INDICATORS
- RSI (14): 45.5, a sharp hook up from 29.2 the prior session. It is leaving oversold territory but is still below 50, with the 14-day pattern of lower highs intact. [Neutral]
- 20 EMA (EMA 21): $12.06, just above the $11.75 price. EMA 21 is falling and sits under EMA 55 ($13.78), so it acts as first resistance. Price closed back near it after a close at $9.85 on Nov 5. [Bearish]
- MACD: Line -0.910 vs signal -0.955. The line crossed above the signal on the last bar (it was -1.013 vs -0.966). It is a bullish crossover, but deep below zero and only marginal. The histogram is barely positive. [Neutral]
- Bollinger Bands (20): Upper $13.23, lower $10.24, mid-band about $11.73. Price pierced the lower band intraday (low near $9.85) and snapped back to the middle. The bands are wide and expanding after the selloff, so this is a lower-band rejection and mean-reversion bounce. [Bullish]
- CMF (20): -0.044, inside the neutral zone. It improved from -0.39 in late October, so selling pressure has eased though accumulation has not started. [Neutral]
- ADX (14): 34.2 and rising, with -DI 32.5 above +DI 17.0. The downtrend is strong, though the gap has narrowed from 38.2 vs 11.2 the prior day. [Strong Trend – Bearish]
- Volume: 27.29M, among the heaviest bars in recent weeks, on a large green reversal candle. That points to a capitulation low and buyers stepping in, though one bar is not confirmation. [Bullish]
DIVERGENCES & TRENDS
- Price made a lower low ($9.85 on Nov 5), but RSI only reached about 29 against the 28.6 readings on Oct 19–20. That is not a clean bullish divergence, just a fading of downside momentum.
- MACD has flattened near -0.9 and just crossed up. Downside momentum has stalled even as price made lower lows, a mild positive.
- All moving averages are stacked bearishly: price ($11.75) < EMA 21 ($12.06) < EMA 55 ($13.78) < SMA50 ($13.96) < VWAP ($15.23) < SMA200 ($16.83). The SMA50 is well below the SMA200, so the death cross is long established.
- Price is far below VWAP and the SMA200, so the long-term trend is firmly down.
- DI spread is narrowing (+DI up to 17.0 from 11.2), which suggests the first signs of buyer participation.
CHART PATTERNS
- Primary structure: A sustained descending channel since August, with lower highs and lower lows, resembling a Bearish Pennant/Flag continuation (lower highs at $12.44 and $12.40, lows at $10.67 and $9.85). A failure at $12.4 would favor this.
- Alternative: The recent leg resembles a Bullish Falling Wedge with a hammer-like reversal bar at the lower Bollinger Band. A close above $12.44 would confirm it, with a measured move toward the EMA 55 and SMA50 zone at $13.8–14.0.
- No clean double bottom has formed. The $10.67 and $9.85 lows are not equal.
POTENTIAL SCENARIOS
- Scenario 1: Bullish Relief Rally — The capitulation wick and high-volume reversal, a fresh MACD cross, RSI recovery and CMF improvement lead to a bounce toward the declining EMA 21 and the recent range highs. Trigger: close above $12.44. Target: $12.15 within 20 days, with an extension to $13.2 (upper Bollinger Band). Invalidation: close below $10.67. (45% probability)
- Scenario 2: Bearish Trend Continuation — The bounce stalls at EMA 21 or $12.4 as a dead-cat bounce. With ADX at 34 and -DI dominant, sellers resume control. Trigger: rejection at $12.06–$12.44 and a close below $11.20. Target: $10.20–$10.67, then a retest of $9.85. Invalidation: close above $12.50 with rising volume. (40% probability)
- Scenario 3: Neutral Basing Range — Price chops between $10.7 and $12.4 as volatility contracts after the capitulation. Trigger: low-volume inside bars and RSI holding 40–55. Target: about $11.60. Invalidation: close outside $10.67–$12.50. (15% probability)
PRICE TARGETS
- Target Price: $12.15 (20-day)
- Expected Range: $10.95 to $12.35. Width is $1.40, about 11.9% of the current price, in line with the 14–21 day guidance.
- Key Levels: Support at $10.67, Resistance at $12.44
OVERALL BIAS
OVERALL BIAS: BULLISH - A high-volume capitulation reversal off the lower Bollinger Band, a fresh MACD bullish cross, a rising RSI and improving CMF favor a modest relief rally toward $12.15. Conviction is limited because price remains below every major moving average with ADX at 34 and -DI dominant.
This is educational analysis and not financial advice.