RGTI 27-day bearish forecast — Nov 8, 2026
- Bias: Bearish
- Timeframe: 27 days (made Nov 8, 2026, target date Dec 4, 2026)
- Price at analysis: $11.75
- Price target: $11.00
- Expected range: $10.30 – $12.10
- Result: Pending — graded after the close on Dec 4, 2026
Get a free AI analysis of RGTI today
Analysis
TECHNICAL INDICATORS
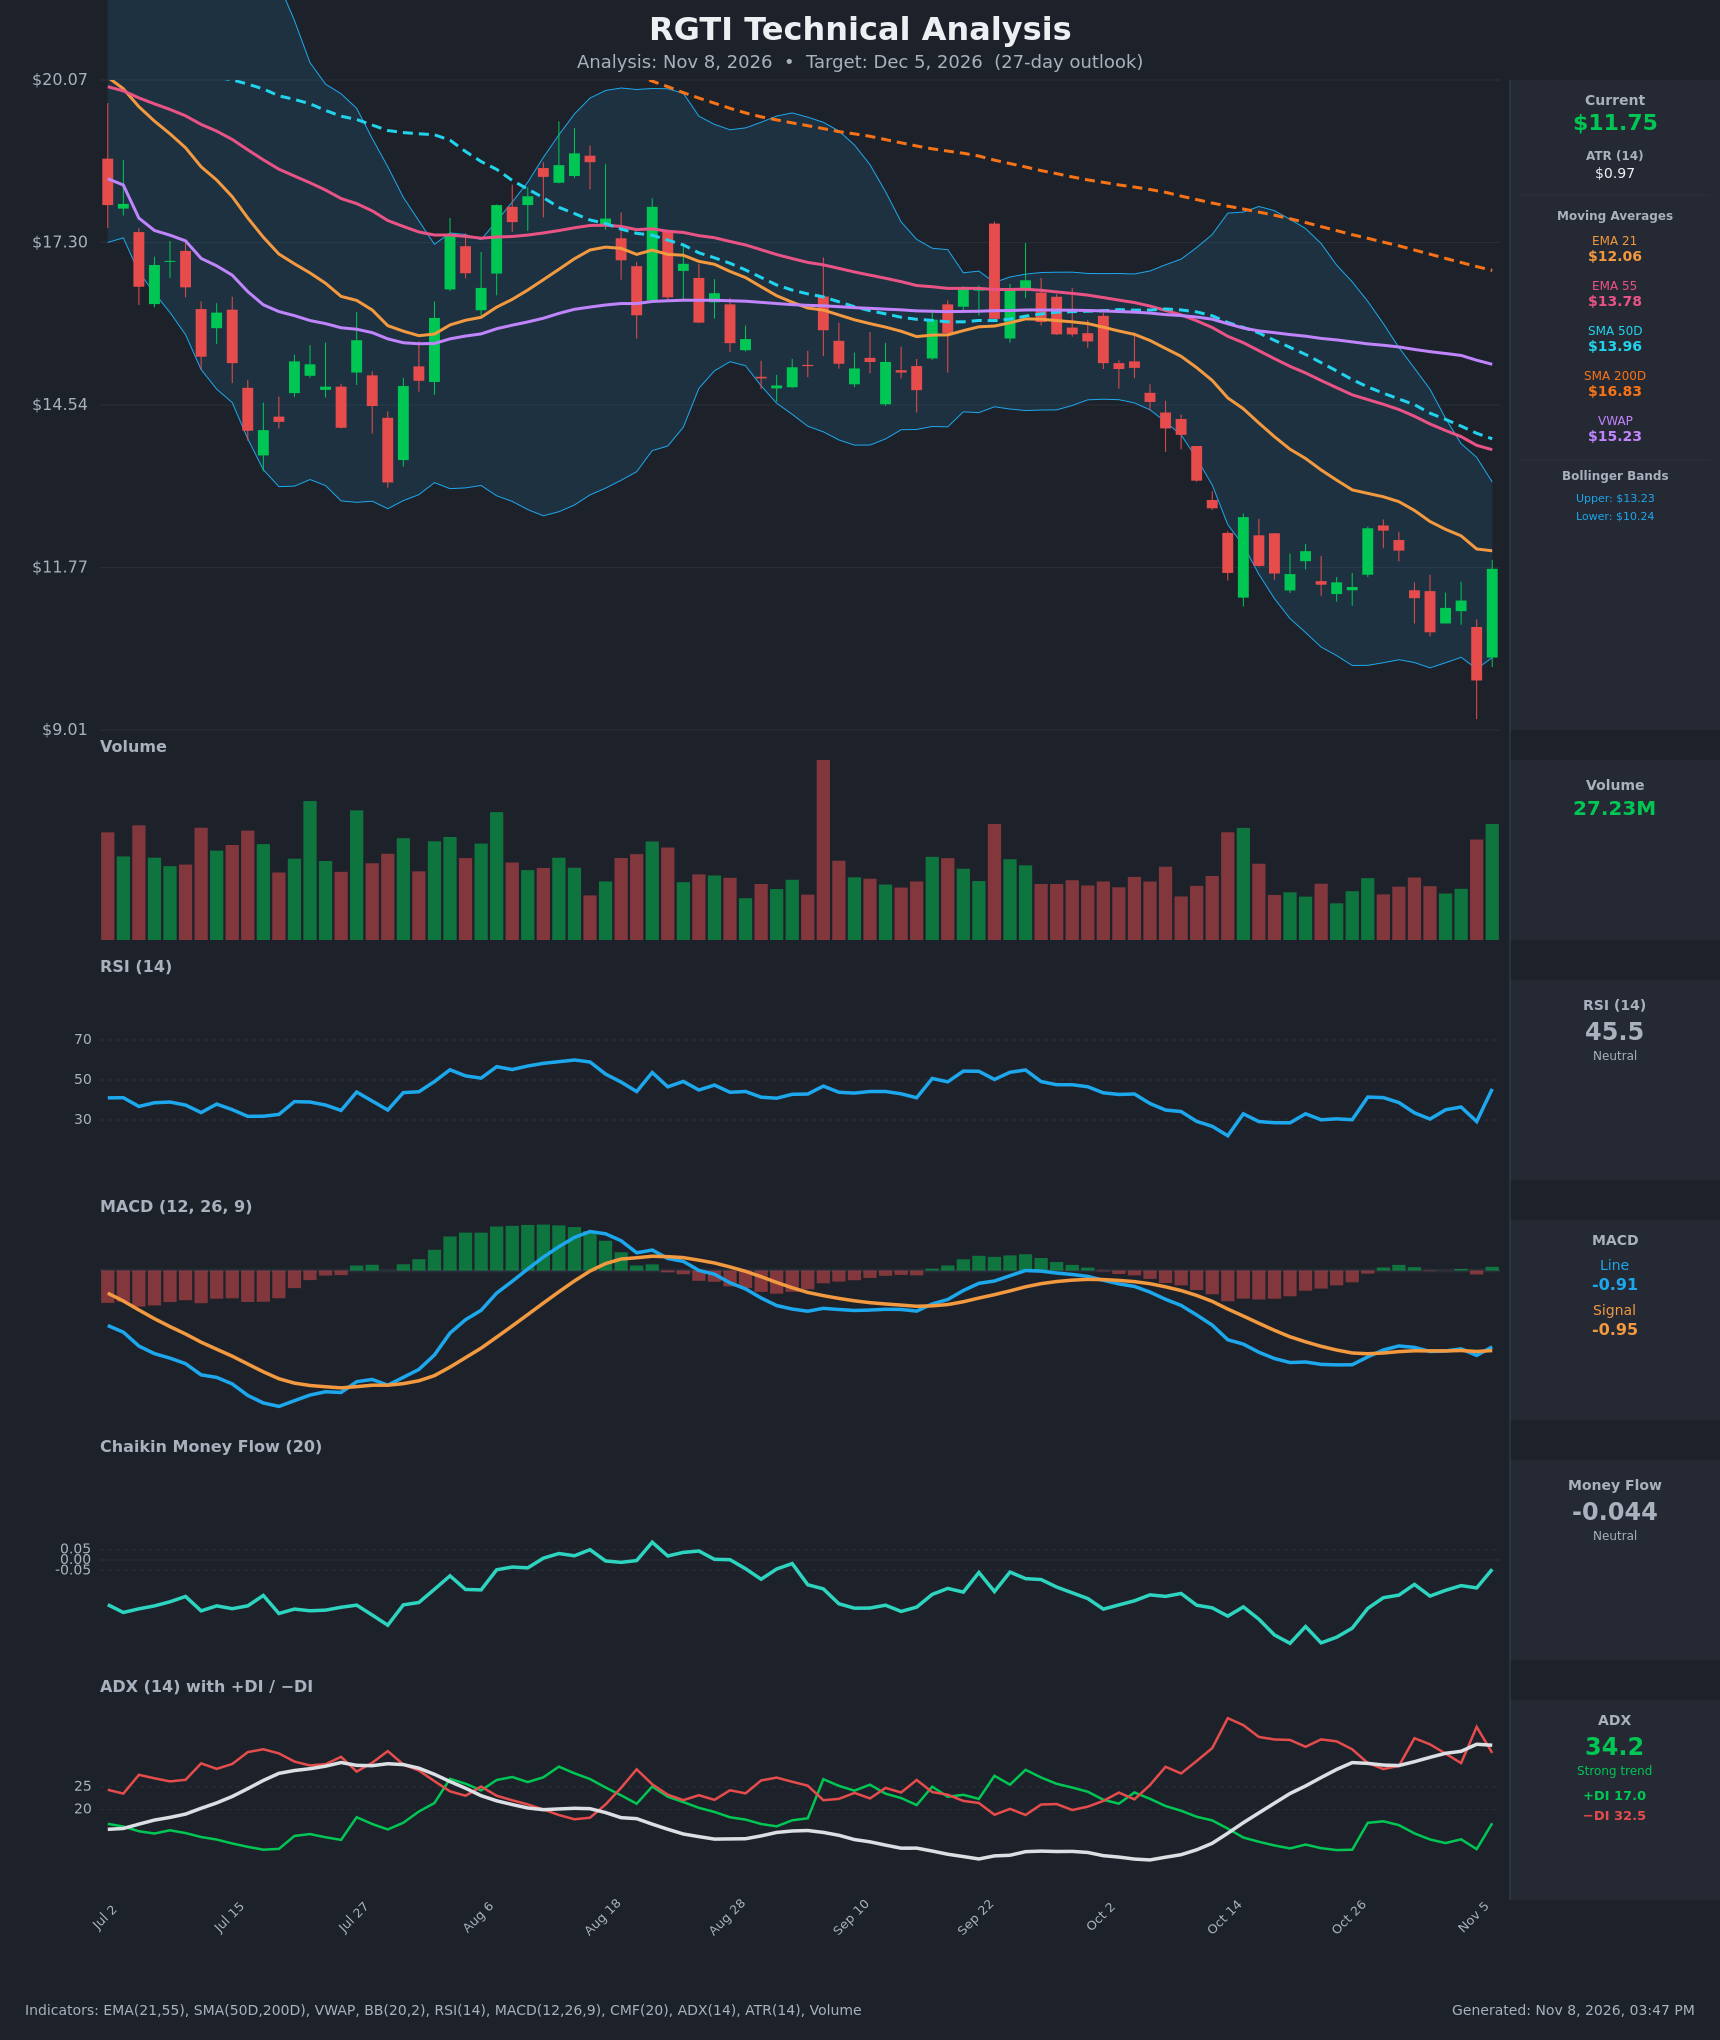
- RSI (14): 45.53, bouncing sharply from 29.2 a day earlier and from the 28-30 oversold zone seen in late October. Momentum is recovering but still below 50, which has capped rallies throughout this downtrend. [Neutral]
- 20 EMA: The 21 EMA is $12.06 and price at $11.75 is below it, so it acts as overhead resistance. The EMA55 at $13.78 is still falling and sits well above price. EMA21 is below EMA55, a bearish stack. [Bearish]
- MACD: Line -0.910 versus signal -0.955, with a marginally positive histogram. The two lines have crossed back and forth for about 8 sessions (a whipsaw), and both remain deeply negative. This is only a tentative momentum stabilization. [Neutral]
- Bollinger Bands (20): Upper $13.23, lower $10.24, midline about $11.73. Price pierced the lower band at $9.85 on Nov 5 and snapped back to the midline. That is a classic oversold snap-back, but the bands are still sloping down, which describes a downtrend ("walking the band") rather than a reversal. [Neutral]
- CMF (20): -0.044, inside the neutral zone and improving from about -0.39 on Oct 20. Selling pressure has faded materially, although accumulation has not started. [Neutral]
- ADX (14): 34.2 and rising, with -DI at 32.5 well above +DI at 17.0. This is a strong, established downtrend. The latest bounce narrowed the DI gap only slightly. [Strong Trend - Bearish]
- Volume: 27.23M on the green bounce candle, among the highest bars of the recent window. This suggests capitulation or a short-covering reaction, but one high-volume day does not confirm a trend change. [Neutral / possible capitulation]
DIVERGENCES & TRENDS
- Moving averages: Price is below the EMA21 ($12.06), EMA55 ($13.78), SMA50D ($13.96), SMA200D ($16.83) and VWAP ($15.23). SMA50D is below SMA200D (death cross), and all of these averages are still declining. This is a long-term downtrend with no broken structure yet.
- CMF divergence: Price made a lower low ($9.85 on Nov 5) versus the Oct 19-20 area ($11.66), while CMF rose from about -0.39 to -0.04. This is a mild bullish divergence showing selling exhaustion.
- RSI: There is no clean RSI divergence, since the 29.2 low is roughly equal to the Oct 19 reading of 28.6. The jump to 45.5 is a one-bar spike and needs follow-through above 50.
- MACD: The MACD line has been flat near -0.9 to -1.1 for three weeks, so downside momentum has stopped accelerating, but there is no bullish crossover above zero.
- ADX/DI: ADX is rising with -DI dominant, so trend-followers remain in control of the bigger picture.
- Price action: The Nov 5 candle had a long lower wick with a reversal close on Nov 6. This is a short-term capitulation signal, but the bounce is meeting the EMA21 at $12.06, which is the first real test.
CHART PATTERNS
- Bearish continuation / flag-like consolidation: After the sharp October drop from about $14.5 to $11.5, price has spent about 2-3 weeks moving sideways in a $10.7-$12.4 band, with lower highs below the falling EMA21. This resembles a Bearish Flag/Pennant that resolves downward. The measured move targets the $9-$10 area.
- Competing signal: The Nov 5 spike below the range followed by a quick recovery above $11.2 looks like a possible bear trap or Bullish Double Bottom attempt (Oct 30/Nov 2 lows near $10.7 and the Nov 5 low at $9.85). It would be confirmed only above about $12.45 (the Oct 27 high), which would open a move to the $13.2-$13.8 area.
- Overall: The bearish flag/continuation reading has more weight because of the trend structure and ADX, but the bounce is real and needs to be respected.
POTENTIAL SCENARIOS
- Scenario 1: Bearish Rejection at EMA21 and Trend Continuation — The bounce stalls at the EMA21 ($12.06) / $12.45 resistance, and sellers resume control while -DI stays dominant. Price drifts back toward the lower Bollinger Band and retests the Nov 5 low zone. Trigger: a daily close back below $11.20, or a failed push above $12.45. Target: $10.20-$10.60, with an extension to $9.85. Invalidation: a daily close above $12.50 with rising volume. (50% probability)
- Scenario 2: Bullish Capitulation Reversal / Mean-Reversion Rally — The Nov 5 flush marks a short-term low, supported by the CMF divergence and heavy volume. Price reclaims the EMA21 and $12.45, then rallies toward the upper Bollinger Band. Trigger: a close above $12.45 with RSI above 50 and a MACD histogram turning clearly positive. Target: $13.20-$13.80 (upper BB and EMA55). Invalidation: a close below $10.70. (35% probability)
- Scenario 3: Neutral Range Chop — Price consolidates between $10.60 and $12.40 as the trend exhausts without resolving. Trigger: repeated failures at both $12.40 and $10.60. Target: about $11.50-$11.90. Invalidation: a close outside $10.40-$12.60. (15% probability)
PRICE TARGETS
- Target Price: $11.00 (27-day timeframe)
- Expected Range: $10.30 to $12.10 (width $1.80, about 15% of the current price, consistent with the 27-day timeframe)
- Key Levels: Support at $9.85, Resistance at $12.06
OVERALL BIAS
OVERALL BIAS: BEARISH - Price remains below every major moving average (death cross in place) with ADX at 34 and -DI dominant, and the bounce is running into EMA21 resistance at $12.06. The CMF improvement and the high-volume Nov 5 reversal suggest a bounce is possible, but the evidence favors the downtrend resuming toward the $10-$11 zone.
This is educational analysis and not financial advice.