RGTI 34-day bearish forecast — Nov 8, 2026
- Bias: Bearish
- Timeframe: 34 days (made Nov 8, 2026, target date Dec 11, 2026)
- Price at analysis: $11.75
- Price target: $10.90
- Expected range: $9.90 – $12.00
- Result: Pending — graded after the close on Dec 11, 2026
Get a free AI analysis of RGTI today
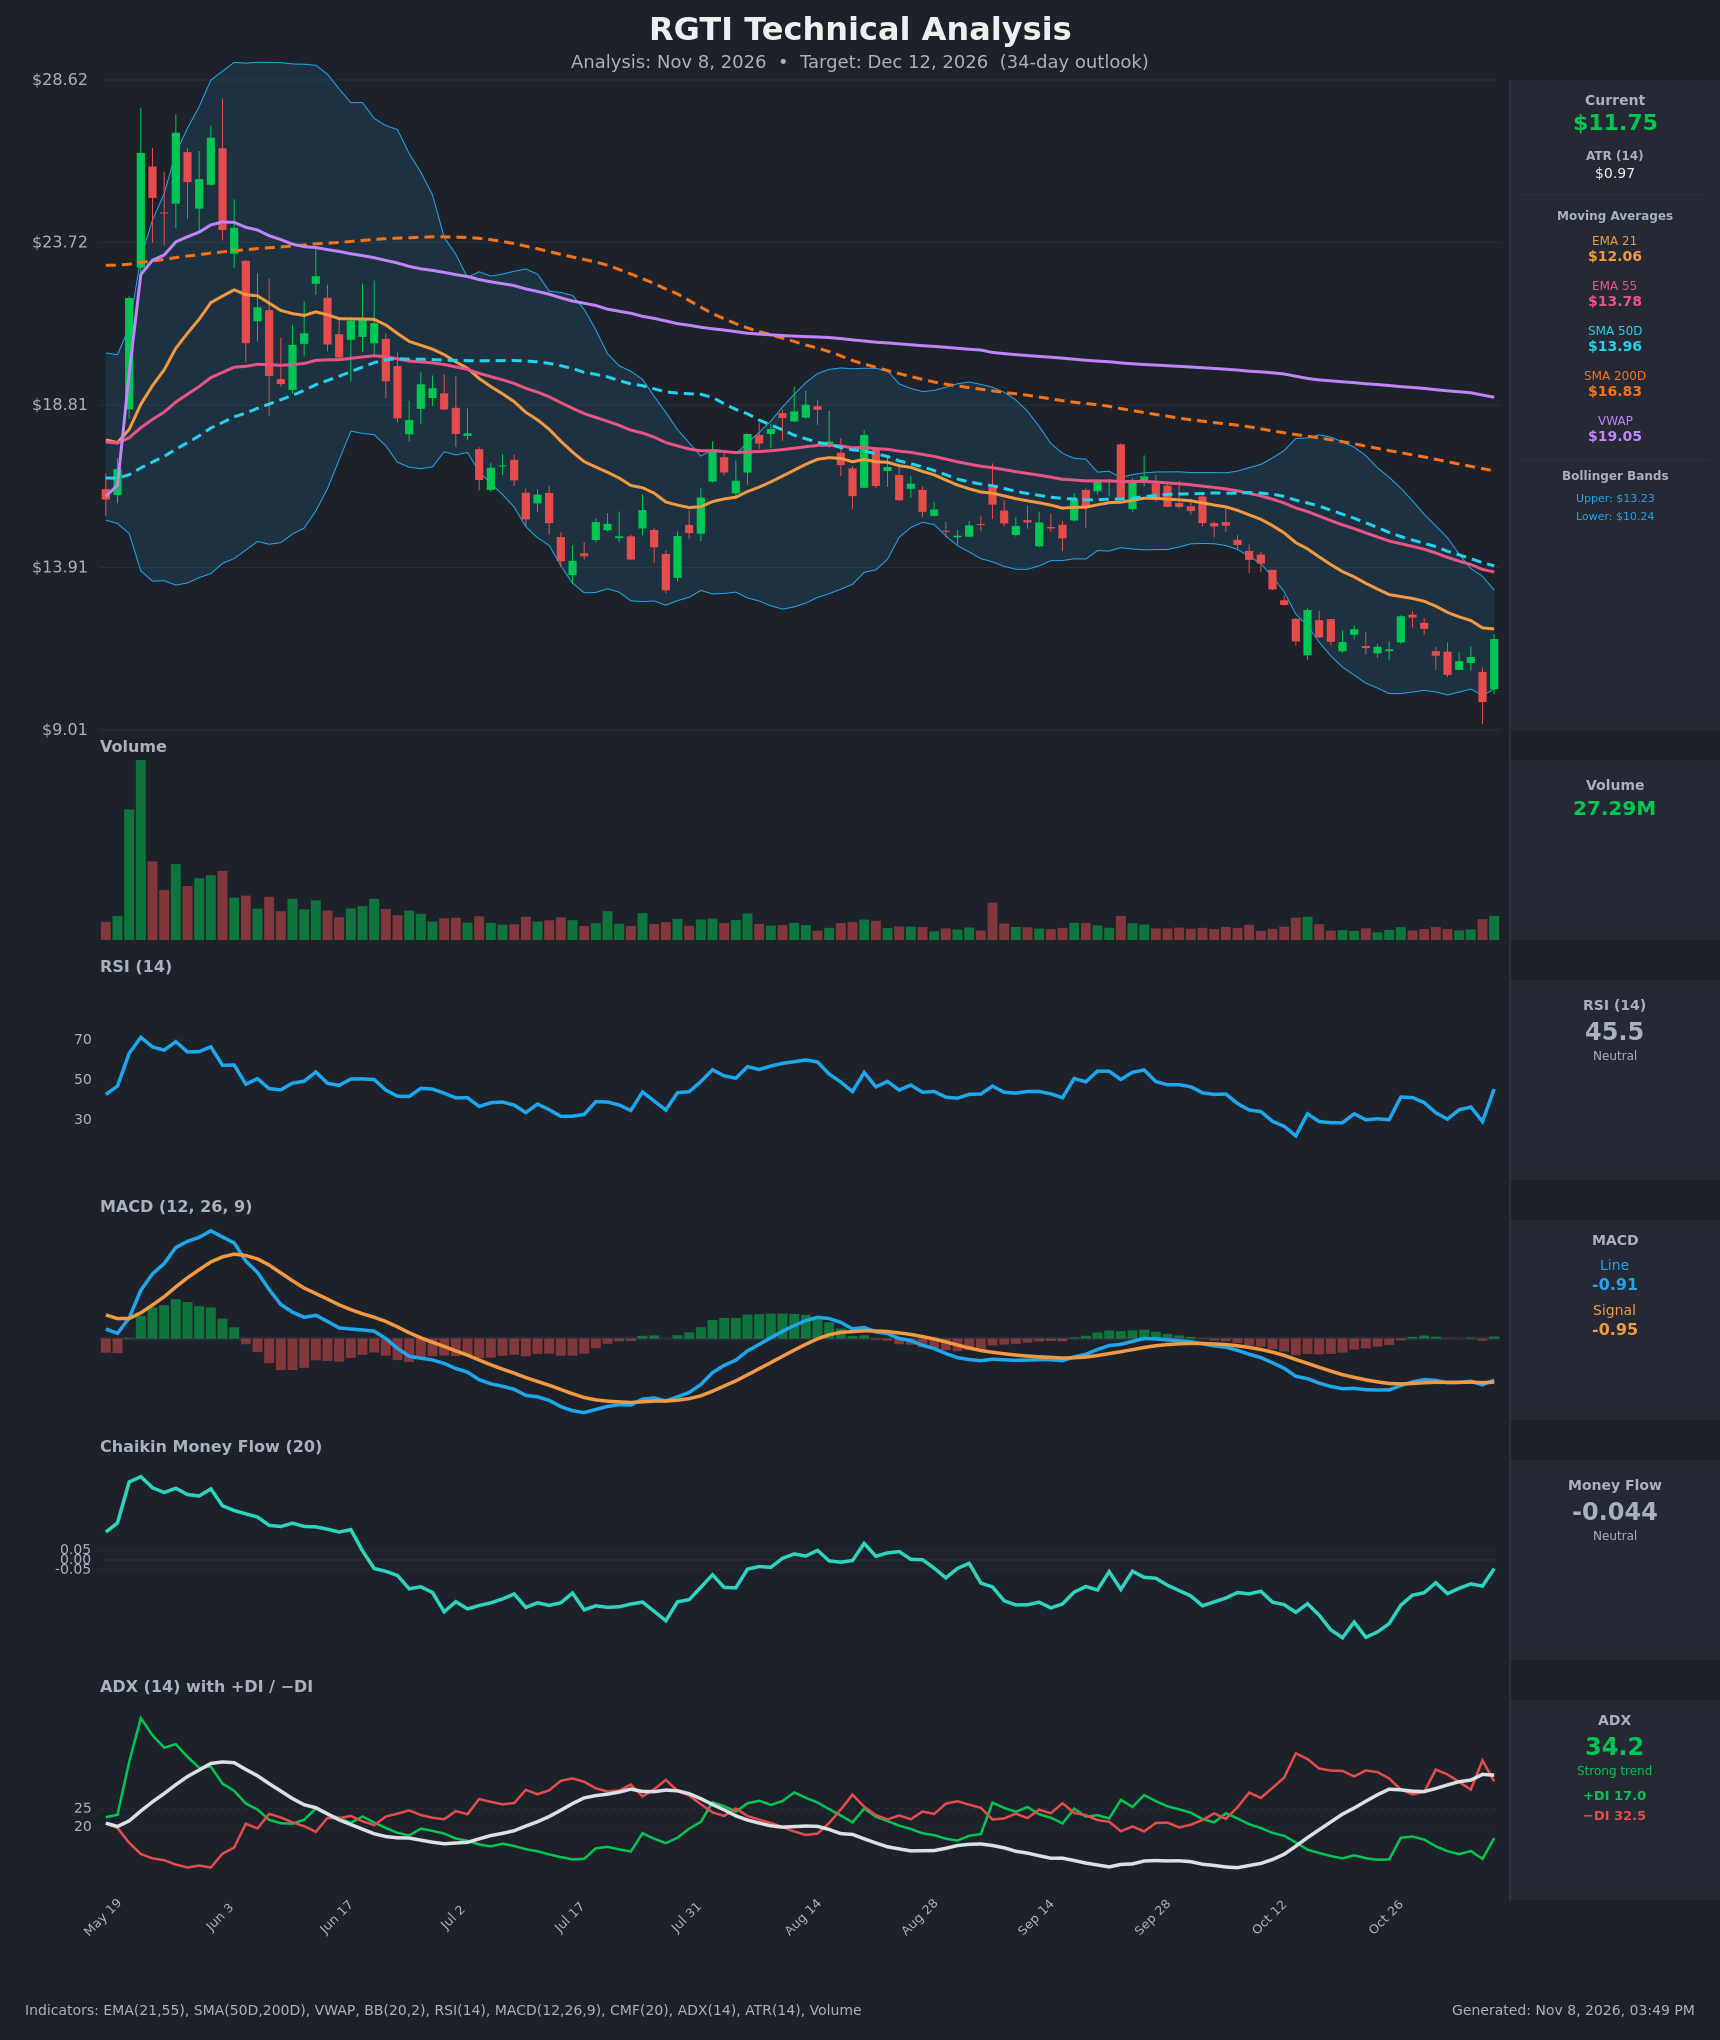
Analysis
TECHNICAL INDICATORS
- RSI (14): 45.53, up sharply from 29.2 on Nov 5. It has lifted out of oversold, but it is still below 50 and has been capped under 50 throughout the decline. Momentum is improving from a washed-out base, not yet confirmed. [Neutral]
- 20 EMA: EMA 21 is $12.06 and price ($11.75) is below it. The EMA 21 is also below the EMA 55 ($13.78), a bearish stack. The EMA 21 is now the first overhead resistance. [Bearish]
- MACD: Line -0.910 vs signal -0.955, so the histogram is barely positive (+0.045). The line crossed back above the signal on Nov 6. Both lines are deeply negative and below zero, so this is a weak relief cross inside a bearish regime. [Neutral]
- Bollinger Bands (20): Upper $13.23, lower $10.24, with price at about the midline ($11.73). Price bounced off the lower band (Nov 5 low near $9.3, below the band) and reclaimed the mid-band. Bands are sloping down, so this is a relief bounce inside a downtrend. [Neutral]
- CMF (20): -0.044, inside the neutral band (±0.05). It has improved from -0.39 in late October, so selling pressure is easing, but there is no accumulation yet. [Neutral]
- ADX (14): 34.2 and rising, with −DI (32.5) well above +DI (17.0). The trend is strong and led by sellers. +DI has bounced from 11 but is still far below −DI. [Strong Trend – Bearish]
- Volume: 27.29M on the +19% bounce day, above the quiet recent average. This is a reversal-type bar after capitulation (Nov 5 close $9.85), but one high-volume green bar does not change the trend. [Mildly Bullish relief, unconfirmed]
DIVERGENCES & TRENDS
- Moving average structure: Price is below the EMA 21 ($12.06), EMA 55 ($13.78), SMA50D ($13.96), SMA200D ($16.83) and VWAP ($19.05). The SMA50D is well below the SMA200D (death cross long in place), and the EMA 21 is below the EMA 55. Every moving average is sloping down.
- RSI: Its lows (about 28-30 in October, 29.2 on Nov 5) are roughly equal while price made a lower low at $9.85. That is a mild bullish divergence, so downside momentum is fading.
- MACD: The line is flattening near -0.9 to -1.1 and has crossed back above the signal. This suggests selling is decelerating, not that the trend has reversed.
- ADX/DI: ADX has risen from about 21 to 34 during the decline, confirming a strong downtrend. −DI remains dominant despite the bounce.
- CMF: It is recovering toward neutral from heavy distribution (-0.39). This is an early sign of selling exhaustion, not accumulation.
- Net read: The bounce is a counter-trend relief move into overhead resistance at $12.06-$13.2. The trend indicators (MAs, ADX/DI) outweigh the early momentum improvement.
CHART PATTERNS
- Primary pattern: A persistent descending channel with lower highs and lower lows since the Jul/Aug peak near $18. This aligns with a continuation structure (bearish flag/pennant family) for the October-November leg down. A flush to about $9.85 followed by a quick recovery to $11.75 is a possible capitulation or hammer-type reversal bar.
- Possible bullish alternative: The decline since early October could be read as a Bullish Falling Wedge. It is not confirmed, because price has not broken above the upper trendline (about $13.2-$13.8, near the SMA50D and EMA 55). A confirmed breakout would target the $15-$16 area.
- Bearish continuation target: A rejection at $12.06-$13.2 and a break below $9.85 would project toward the $8.50-$9.00 area, using the height of the recent $9.85-$13.2 range.
POTENTIAL SCENARIOS
- Scenario 1: Bearish Rejection and Trend Continuation — The bounce stalls at the EMA 21 and the mid-to-upper Bollinger area as −DI stays dominant, and price drifts back toward the recent lows. Trigger: rejection at $12.06-$12.50 followed by a daily close below $10.67. Target: $10.00-$10.90, with an extension to $9.00 on a break of $9.85. Invalidation: a daily close above $13.25 (upper Bollinger Band) on rising volume. (50% probability)
- Scenario 2: Bullish Relief Rally — The capitulation reversal holds, the MACD cross extends and the RSI pushes above 50, squeezing price up into the declining moving averages. Trigger: a daily close above $12.44 (late-October high) and then $13.23. Target: $13.20-$13.90 (upper Bollinger Band, EMA 55, SMA50D). Invalidation: a close below $10.67 or $9.85. (30% probability)
- Scenario 3: Neutral Choppy Base — Price consolidates between $10.50 and $12.50 as the ADX cools and CMF hovers near zero. Trigger: failure to break either the $12.44 high or the $10.67 low. Target: $11.00-$12.00. Invalidation: a decisive close outside $10.00-$13.25. (20% probability)
PRICE TARGETS
- Target Price: $10.90 (34 days, Dec 12, 2026)
- Expected Range: $9.90 to $12.00 (width $2.10, about 17.9% of the current price, in line with the 30-60 day guidance)
- Key Levels: Support at $9.85, Resistance at $12.06
OVERALL BIAS
OVERALL BIAS: BEARISH - Price sits below every major moving average and VWAP, the ADX is 34.2 and rising with −DI (32.5) far above +DI (17.0), and the EMA and SMA bearish stacks are intact. The recent bounce, with RSI at 45.5 and a marginal MACD cross, looks like a relief rally into resistance at $12.06-$13.2. Conviction is moderate because of the capitulation-style reversal bar.
This is educational analysis and not financial advice.