RGTI 55-day bearish forecast — Nov 8, 2026
- Bias: Bearish
- Timeframe: 55 days (made Nov 8, 2026, target date Jan 1, 2027)
- Price at analysis: $11.75
- Price target: $10.60
- Expected range: $9.60 – $11.80
- Result: Pending — graded after the close on Jan 1, 2027
Get a free AI analysis of RGTI today
Analysis
TECHNICAL INDICATORS
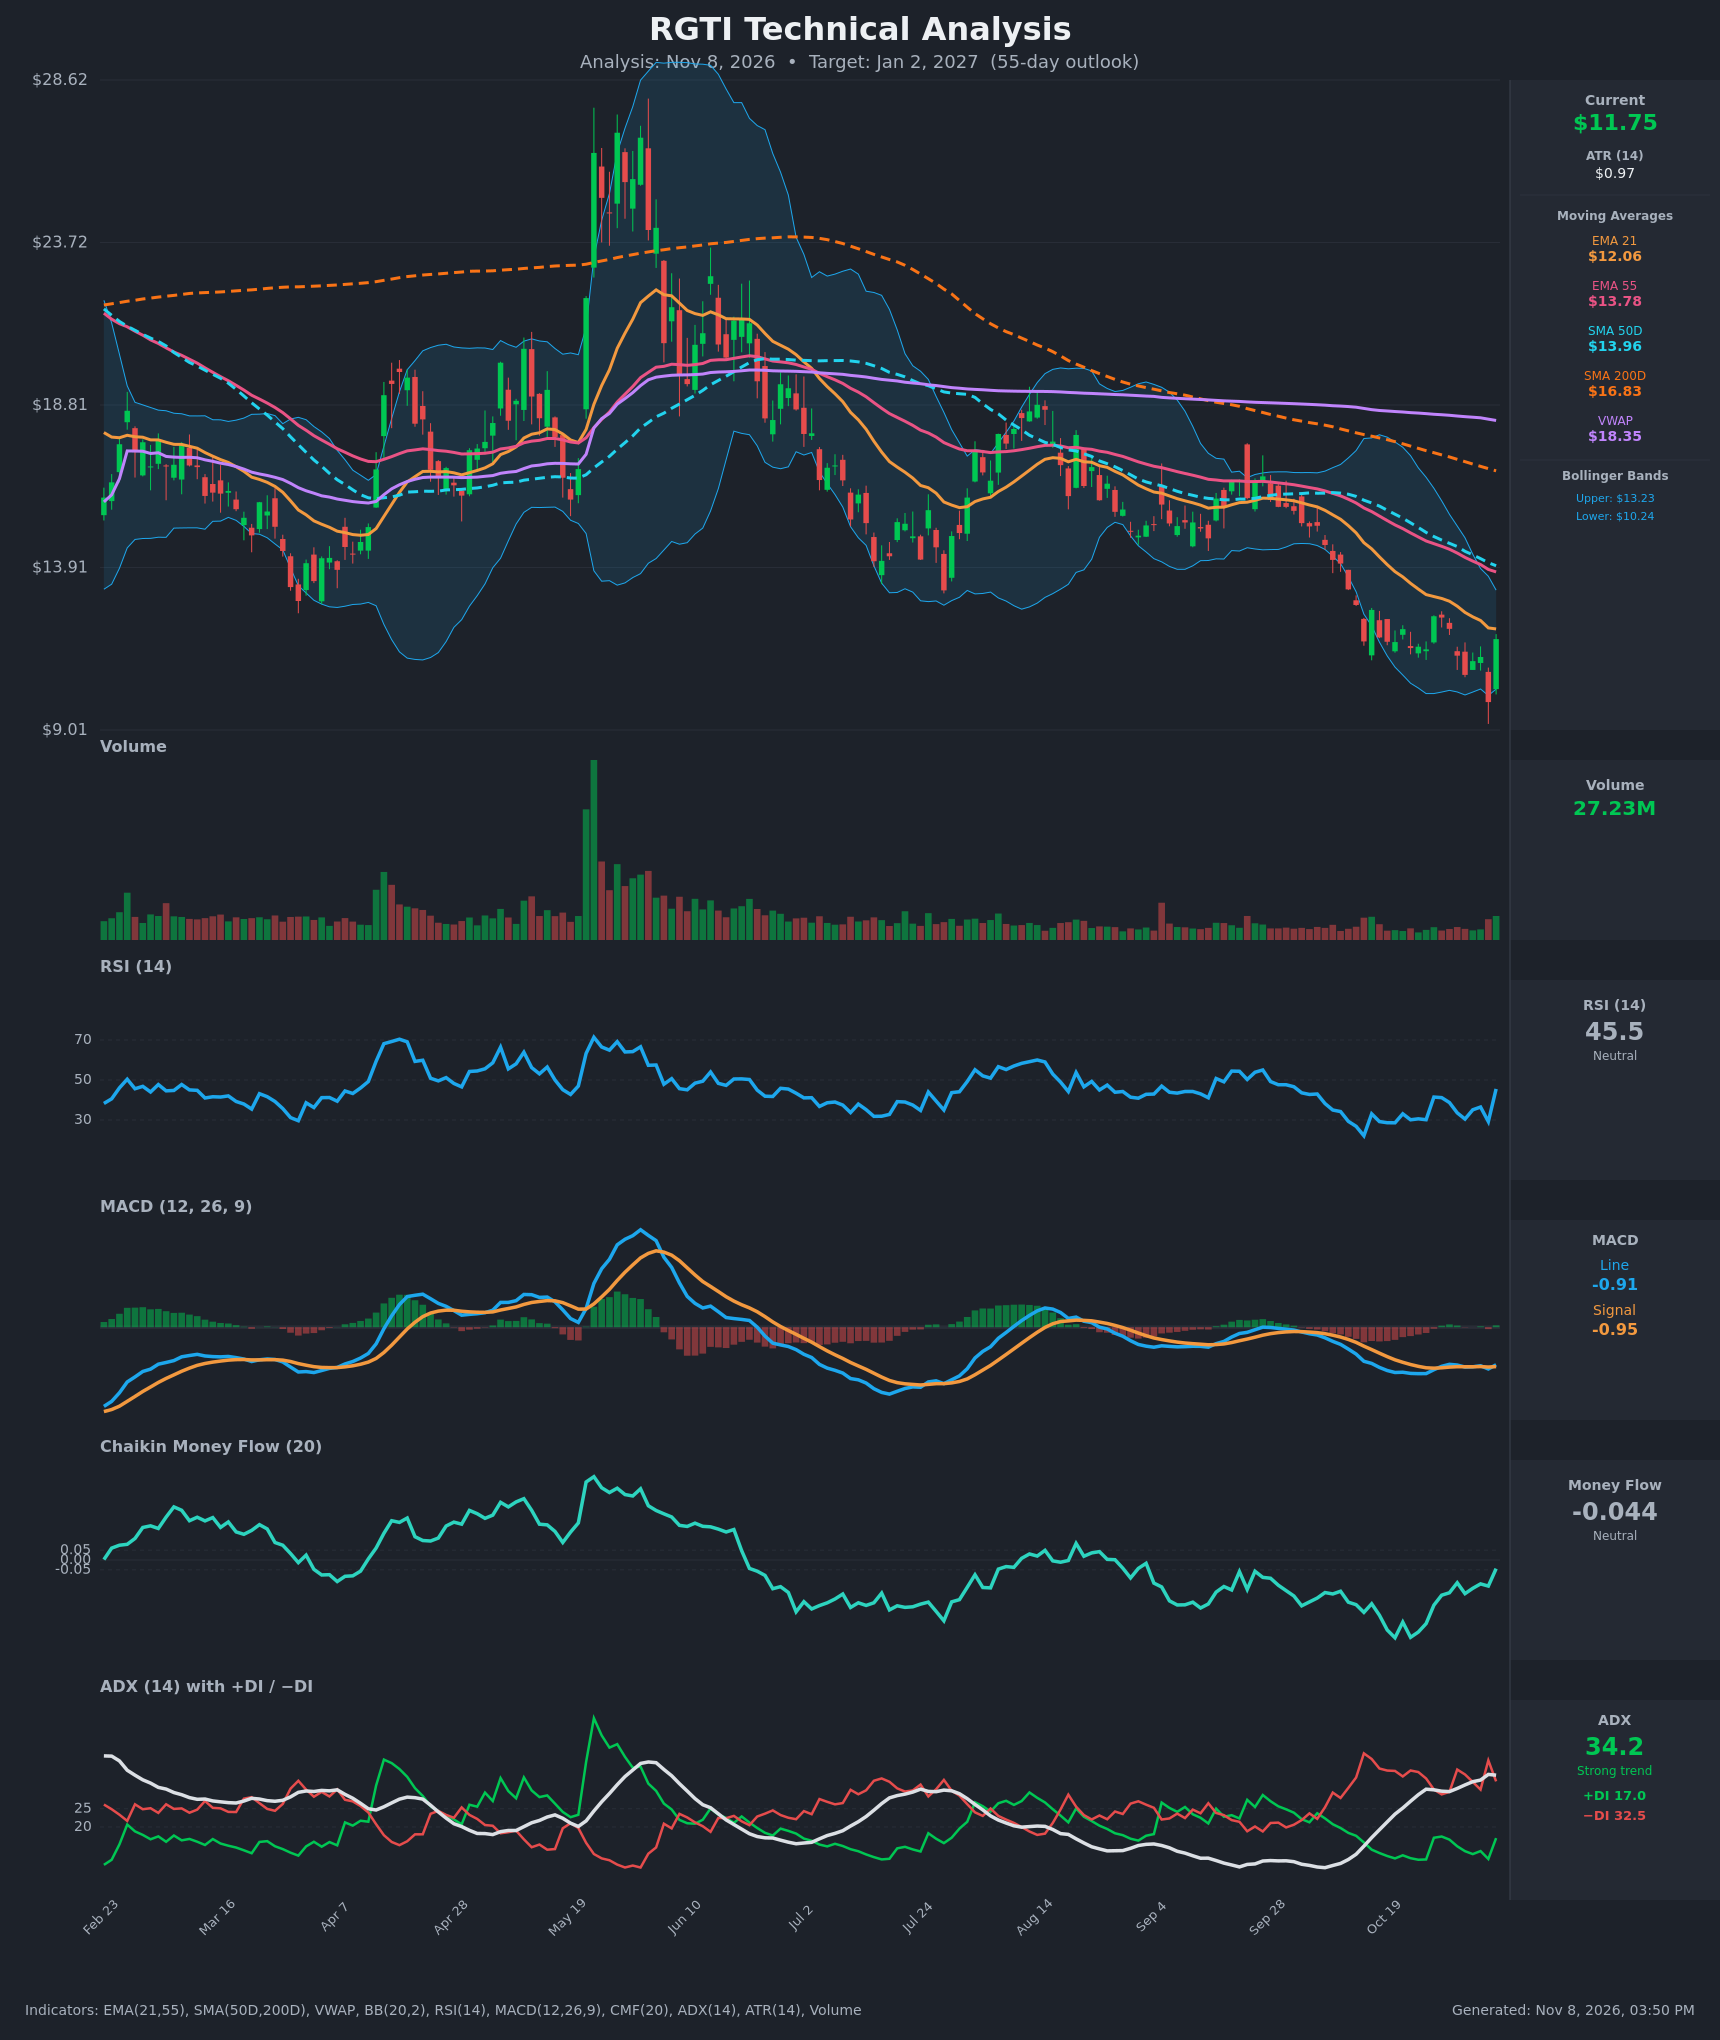
- RSI (14): 45.53, bouncing sharply from 29.2 on Nov 5 and back to the mid-range. The bounce is real, but RSI has spent most of the last month between 28 and 41 and is still below 50, so it only shows relief from oversold. [Neutral]
- 20 EMA: The supplied EMA 21 is $12.06 and price is $11.75, just below it. EMA 21 is falling (14.00 to 12.06 in 15 bars) and sits below EMA 55 ($13.78), so it acts as first overhead resistance. [Bearish]
- MACD: Line -0.910 versus signal -0.955, a marginal positive histogram of about +0.04. The line has flipped above the signal several times in the last few bars (Nov 4, then below on Nov 5, then above again on Nov 6). Both lines are deeply negative and flat, so this is a weak, low-conviction cross rather than a trend change. [Neutral]
- Bollinger Bands (20): Upper $13.23, lower $10.24, with price at $11.75 in the lower half of the bands. The bands are rolling over with the downtrend. Price tagged and pierced the lower band on Nov 5 (low near $9.0) and snapped back inside. Reclaiming the middle band (about $11.7 to $11.8) is the first test. [Neutral]
- CMF (20): -0.044, inside the neutral band but improving from -0.39 on Oct 20. Selling pressure has faded without turning into accumulation. [Neutral]
- ADX (14): 34.2 and rising, with −DI at 32.5 above +DI at 17.0. This is a strong trend with bears in control. The +DI uptick (11 to 17) shows the bounce, but the gap remains wide. [Strong Trend - Bearish]
- Volume: 27.23M on the Nov 6 bounce, the highest in several weeks. It supports a capitulation or washout reversal candle, but one high-volume green day after a long decline is not yet confirmation. [Relief bounce / possible capitulation]
DIVERGENCES & TRENDS
- Price made a new low on Nov 5 ($9.85 close) while RSI (29.2) stayed above its Oct 19-20 low (28.6) by only a hair. This is a very marginal, unconfirmed positive divergence.
- Price is below every moving average: EMA 21 ($12.06), EMA 55 ($13.78), SMA 50D ($13.96), SMA 200D ($16.83) and VWAP ($18.35). The SMA 50D is well below the SMA 200D, so the death cross is in place and the long-term trend is down.
- EMA 21 is below EMA 55 and the gap is widening, so the bearish EMA structure is intact.
- The MACD crossover is tiny and occurs far below zero. It is a momentum-stabilization signal only.
- Lower highs have persisted since the August peak near $19. The last rally attempt failed at $12.44 (Oct 27) and the September high around $16 also failed.
- CMF has recovered from -0.39 to -0.04, an improving trend that shows distribution easing.
- ADX rose from 21 to 34 during the decline, which confirms the trend was driven by sellers.
CHART PATTERNS
- Primary structure: The broad decline from the May spike near $28 to $11.75 is a sequence of lower highs and lower lows. This resembles a Bearish Flag/Descending channel continuation and a large head-and-shoulders-style distribution. The measured-move area from that breakdown points toward the low-$10s and possibly the high-$9s.
- Counter-pattern: The recent action (a long lower wick to about $9.0, then a +19% day) could be the first low of a Bullish Double Bottom or a Bullish Falling Wedge reversal. It is not confirmed. A double bottom would need a retest of about $9.85 to $10.25 that holds, then a break above about $12.4.
- Significance: The bounce stalls at EMA 21 ($12.06), the Oct 27 high ($12.44) and the BB upper/EMA 55 zone ($13.2 to $13.8). A rejection there would confirm continuation lower.
POTENTIAL SCENARIOS
- Scenario 1: Bearish Trend Continuation — The bounce fades at the falling EMA 21 / Oct 27 high zone and sellers (−DI > +DI, ADX > 30) resume control, retesting the Nov 5 low and probing below it. Trigger: rejection at $12.06 to $12.45, then a close below $10.24 (lower BB). Target: $10.00 to $9.60 (new low area near $9.0 in an extension). Invalidation: daily close above $13.25 (BB upper/EMA 55 zone). (50% probability)
- Scenario 2: Bullish Capitulation Reversal — The Nov 5 wick and high-volume bounce marks a washout low. Price reclaims EMA 21, MACD turns positive and CMF moves above +0.05, which could carry it to the EMA 55/SMA 50D area. Trigger: close above $12.45 on strong volume. Target: $13.80 to $14.00, with an extension to $15.5. Invalidation: close below $9.85. (35% probability)
- Scenario 3: Neutral Base Building — Price chops between roughly $10.2 and $12.4 as momentum resets and ADX fades. Trigger: repeated failures on both sides of the range. Target: $11.00 to $12.00. Invalidation: close outside $10.0 to $12.5. (15% probability)
PRICE TARGETS
- Target Price: $10.60 (55 days, Jan 2, 2027)
- Expected Range: $9.60 to $11.80 (width $2.20, about 18.7% of the current price, consistent with the 30-60 day guidance)
- Key Levels: Support at $10.24 (lower Bollinger Band; below it, $9.85 Nov 5 close), Resistance at $12.06 (EMA 21; above it, $13.23 BB upper and $13.78 EMA 55)
OVERALL BIAS
OVERALL BIAS: BEARISH - Price is below every moving average (including a death-cross configuration), ADX is 34 and rising with −DI far above +DI, and the bounce is stalling under the falling EMA 21. The Nov 6 rebound and weak MACD cross offer only relief-rally potential until price reclaims about $12.45.
This is educational analysis and not financial advice.