RGTI 83-day bearish forecast — Nov 8, 2026
- Bias: Bearish
- Timeframe: 83 days (made Nov 8, 2026, target date Jan 29, 2027)
- Price at analysis: $11.75
- Price target: $10.40
- Expected range: $8.80 – $12.30
- Result: Pending — graded after the close on Jan 29, 2027
Get a free AI analysis of RGTI today
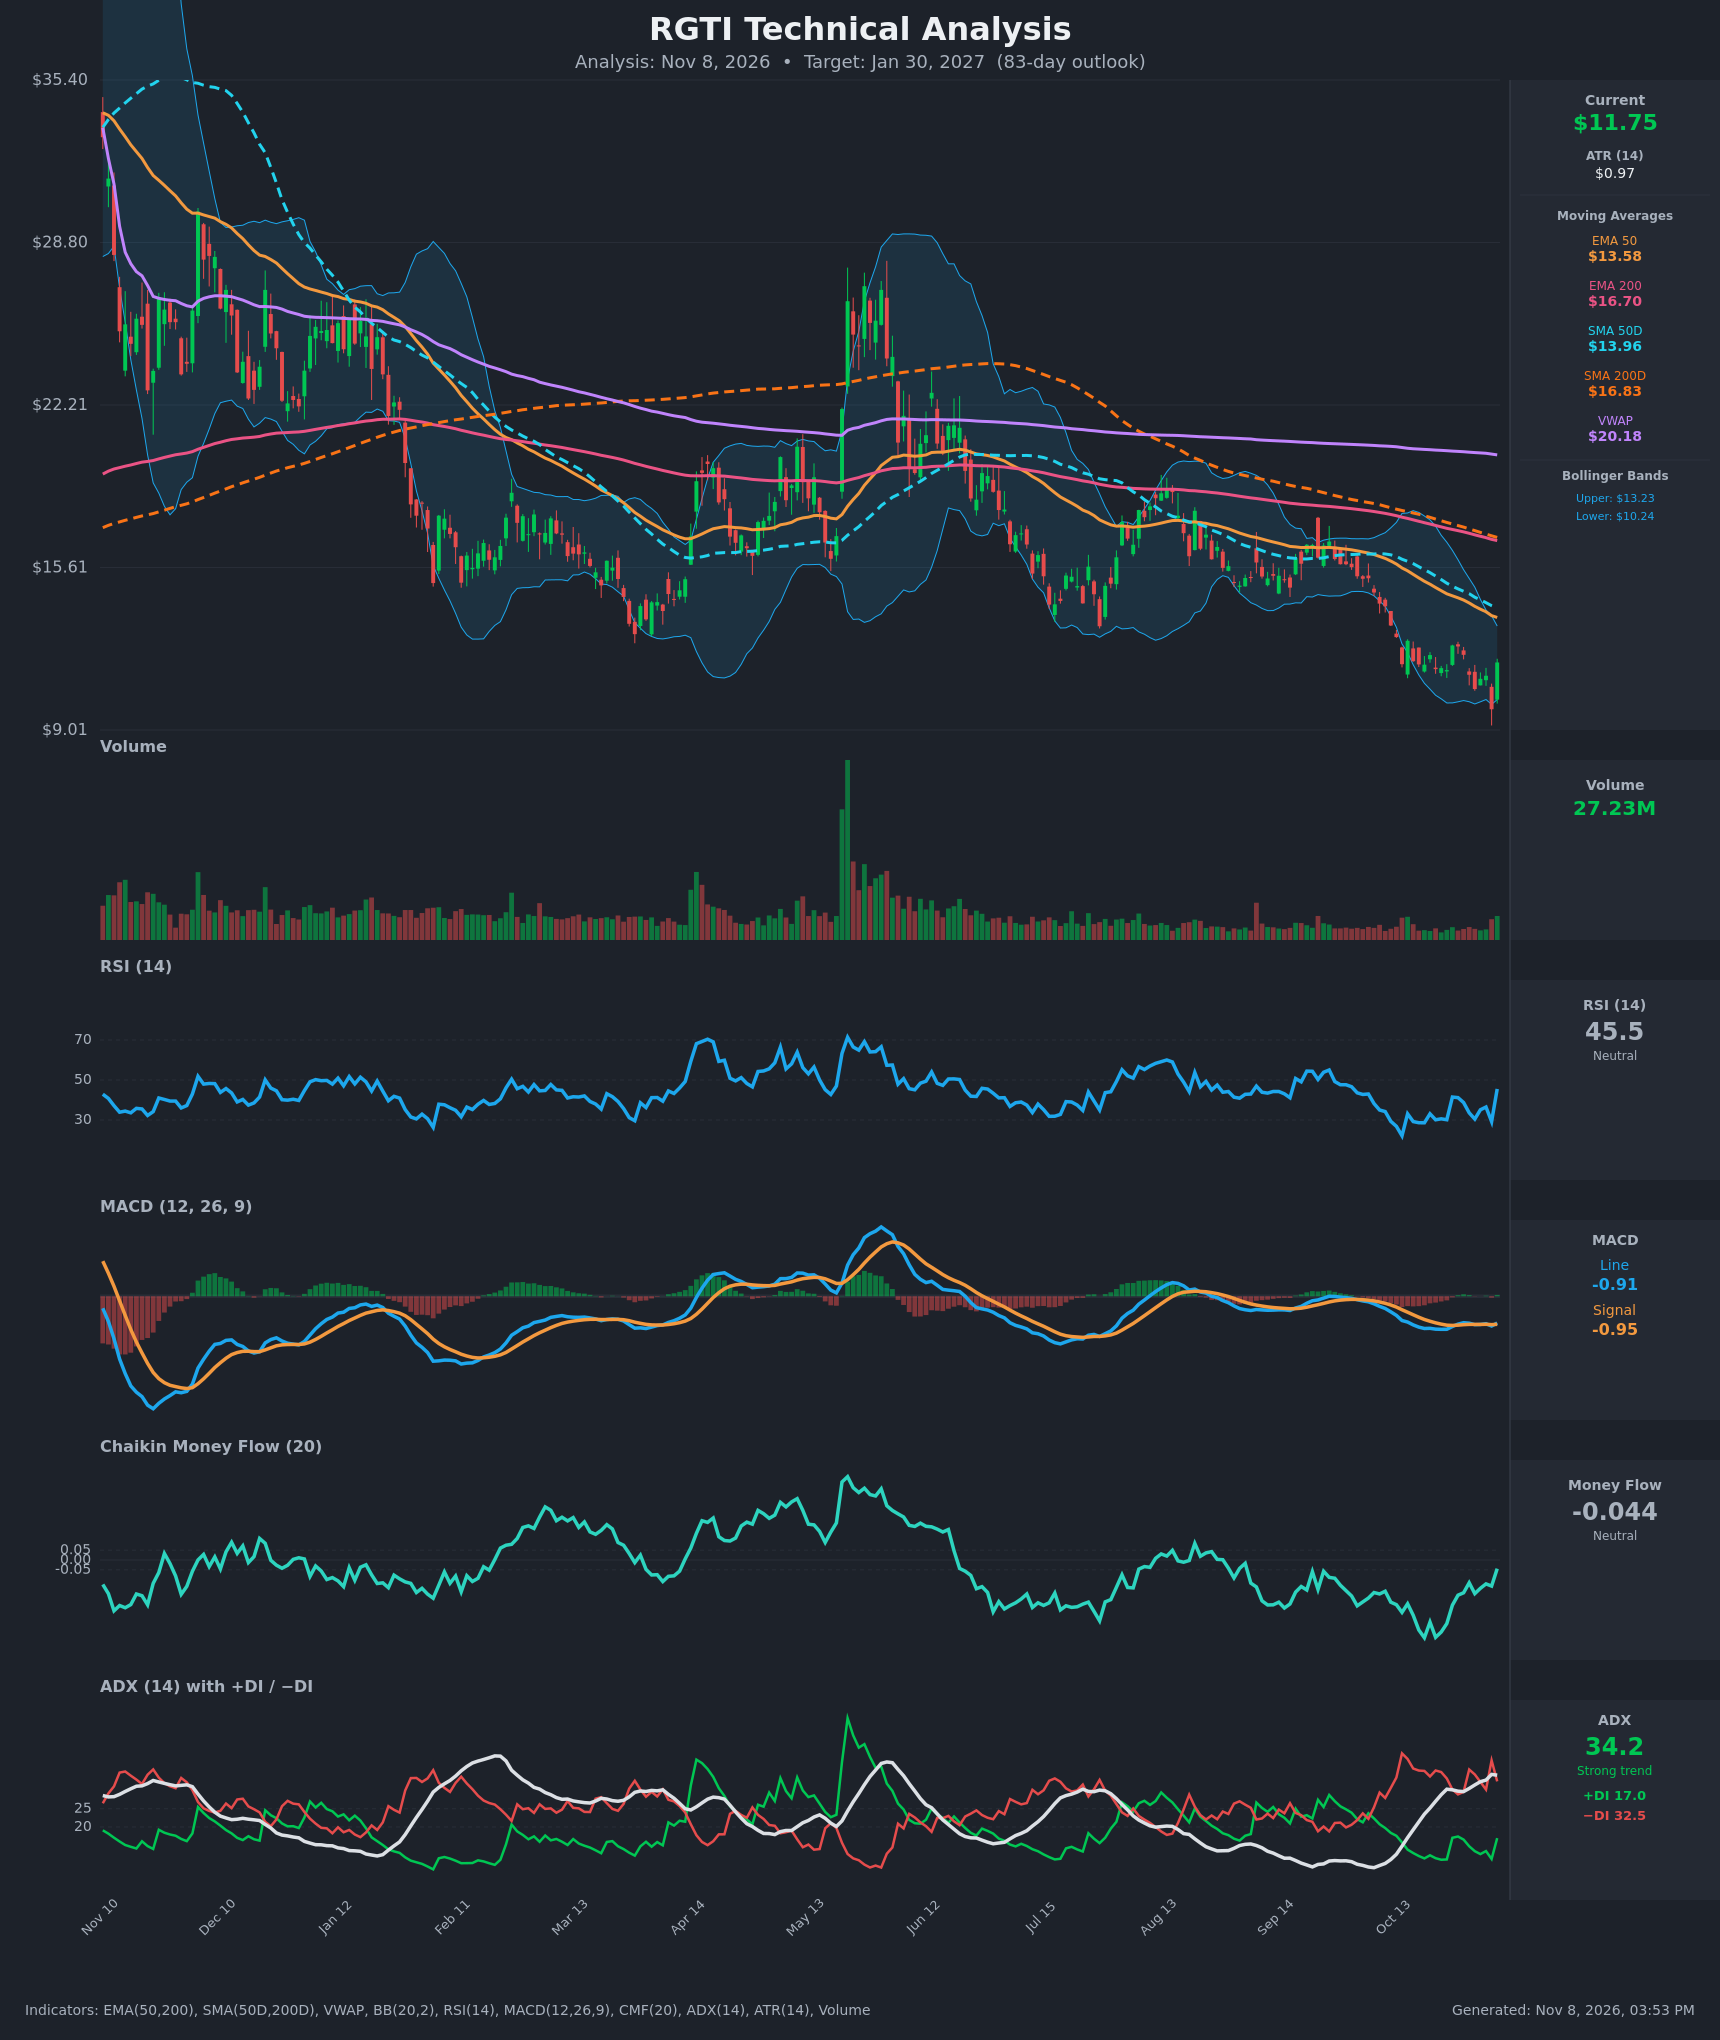
Analysis
TECHNICAL INDICATORS
- RSI (14): 45.53, up sharply from 29.2 the prior day (and about 28 in late October). It is bouncing from oversold but is still below 50 and has made lower highs through the decline. [Neutral]
- 20 EMA: The 20 EMA value wasn't supplied. The Bollinger midline (the 20-period SMA) is about $11.73, so price sits right on it after a one-day pop. Price is far below EMA50 ($13.58) and EMA200 ($16.70), which act as overhead resistance. [Bearish]
- MACD: Line -0.91 versus signal -0.955, a marginal bullish crossover with the histogram just turning slightly positive. Both lines are deeply below zero, so this is a weak relief signal rather than a trend reversal. [Neutral]
- Bollinger Bands (20): Upper $13.23, lower $10.24, with price near the midline after bouncing from a close below the lower band area ($9.85). Bands are fairly wide, and the bounce off the lower band is a mean-reversion move inside a downtrend. [Neutral]
- CMF (20): -0.044, improved from -0.39 but still negative and just inside the neutral zone. It has been mostly below zero since June, so distribution is easing but has not flipped to accumulation. [Neutral]
- ADX (14): 34.2 and rising, with −DI (32.5) far above +DI (17.0). The trend is strong and bearish, although +DI rebounded from 11.2 to 17.0 on the last bar. [Strong Trend – Bearish]
- Volume: 27.23M on the +19% bounce day, above the quiet volume of recent weeks. It is a notable uptick but is not a climactic reversal spike like the May surge. [Mild relief buying, unconfirmed]
DIVERGENCES & TRENDS
- Price made a new low on Nov 5 ($9.85) while RSI (29.2) stayed at roughly the same level as the Oct 19-20 lows (28.6). There is no clear bullish divergence, only a shallow double-bottom-like oversold zone.
- MACD histogram has compressed toward zero and the line is crossing above the signal. Because it is happening far below zero, it is more a pause in selling than a trend change.
- The SMA50D ($13.96) is well below the SMA200D ($16.83), so the death cross is already in place. EMA50 is also below EMA200, and both pairs are still diverging downward.
- Price is far below VWAP ($20.18), which shows long-term sellers are underwater and likely to sell into rallies.
- The ADX rise from about 21 to 34 with −DI dominant shows the downtrend is accelerating, not exhausted.
- The chart shows a persistent series of lower highs and lower lows since the May spike.
CHART PATTERNS
- Descending channel / Bearish continuation: Since June, price has made lower highs and lower lows, rejected by the declining EMA50 and SMA50D. This resembles the continuation structure in the reference diagram (bearish flag/descending triangle family), and the broader trend points lower.
- Possible Bullish Falling Wedge (low confidence): The compressing decline from September to now, with the bounce off $9.85, hints at a wedge. It needs a close above about $13.2-13.6 (the upper band and EMA50) to confirm, and no such break exists yet.
- Possible Double Bottom (Nov 2 at $10.67, Nov 5 at $9.85): Neither low is matched closely enough to count, and the neckline (about $12.44) hasn't been cleared.
- Significance: The bearish continuation is the base case. A measured move lower extends toward the $9-10 area, and a breakdown of $9.85 would open the way to the high-$8s.
POTENTIAL SCENARIOS
- Scenario 1: Bearish Trend Continuation — The Nov 6 bounce fades at the Bollinger midline and the EMA50 area, and −DI stays dominant. Price retests and breaks the $9.85 low. Trigger: rejection at $12.40-13.20 and a close below $10.24. Target: $9.00-$10.40. Invalidation: daily close above $13.60 (EMA50 and the upper band). (50% probability)
- Scenario 2: Bullish Relief Rally / Basing — Short covering after the capitulation low, MACD crossover and improving CMF carry price to the declining moving averages. Trigger: close above $12.44 and then $13.23 on rising volume. Target: $13.60-$14.00 (EMA50/SMA50D), with an extension to $15 only on a breakout. Invalidation: close below $9.85. (30% probability)
- Scenario 3: Neutral Range Chop — Price oscillates between the $10 low and $13 resistance as ADX cools. Trigger: failure to break either $9.85 or $13.23. Target: $10.50-$12.50. Invalidation: close outside $9.80-$13.60. (20% probability)
PRICE TARGETS
- Target Price: $10.40 (83-day horizon)
- Expected Range: $8.80 to $12.30. The width is $3.50, about 29.8% of the current price, in line with the 61-180 day guide (18-30%). This stock is volatile (ATR ≈ 8% of price), so the range sits at the upper end of the guide.
- Key Levels: Support at $9.85, Resistance at $13.23
OVERALL BIAS
OVERALL BIAS: BEARISH - Price is below every major moving average with a death cross in place, ADX at 34 with −DI far above +DI, and persistent lower highs. The latest bounce is only a relief move into the Bollinger midline and has not broken any resistance.
This is educational analysis and not financial advice.