RGTI 97-day bearish forecast — Nov 8, 2026
- Bias: Bearish
- Timeframe: 97 days (made Nov 8, 2026, target date Feb 12, 2027)
- Price at analysis: $11.75
- Price target: $10.40
- Expected range: $9.00 – $12.50
- Result: Pending — graded after the close on Feb 12, 2027
Get a free AI analysis of RGTI today
Analysis
TECHNICAL INDICATORS
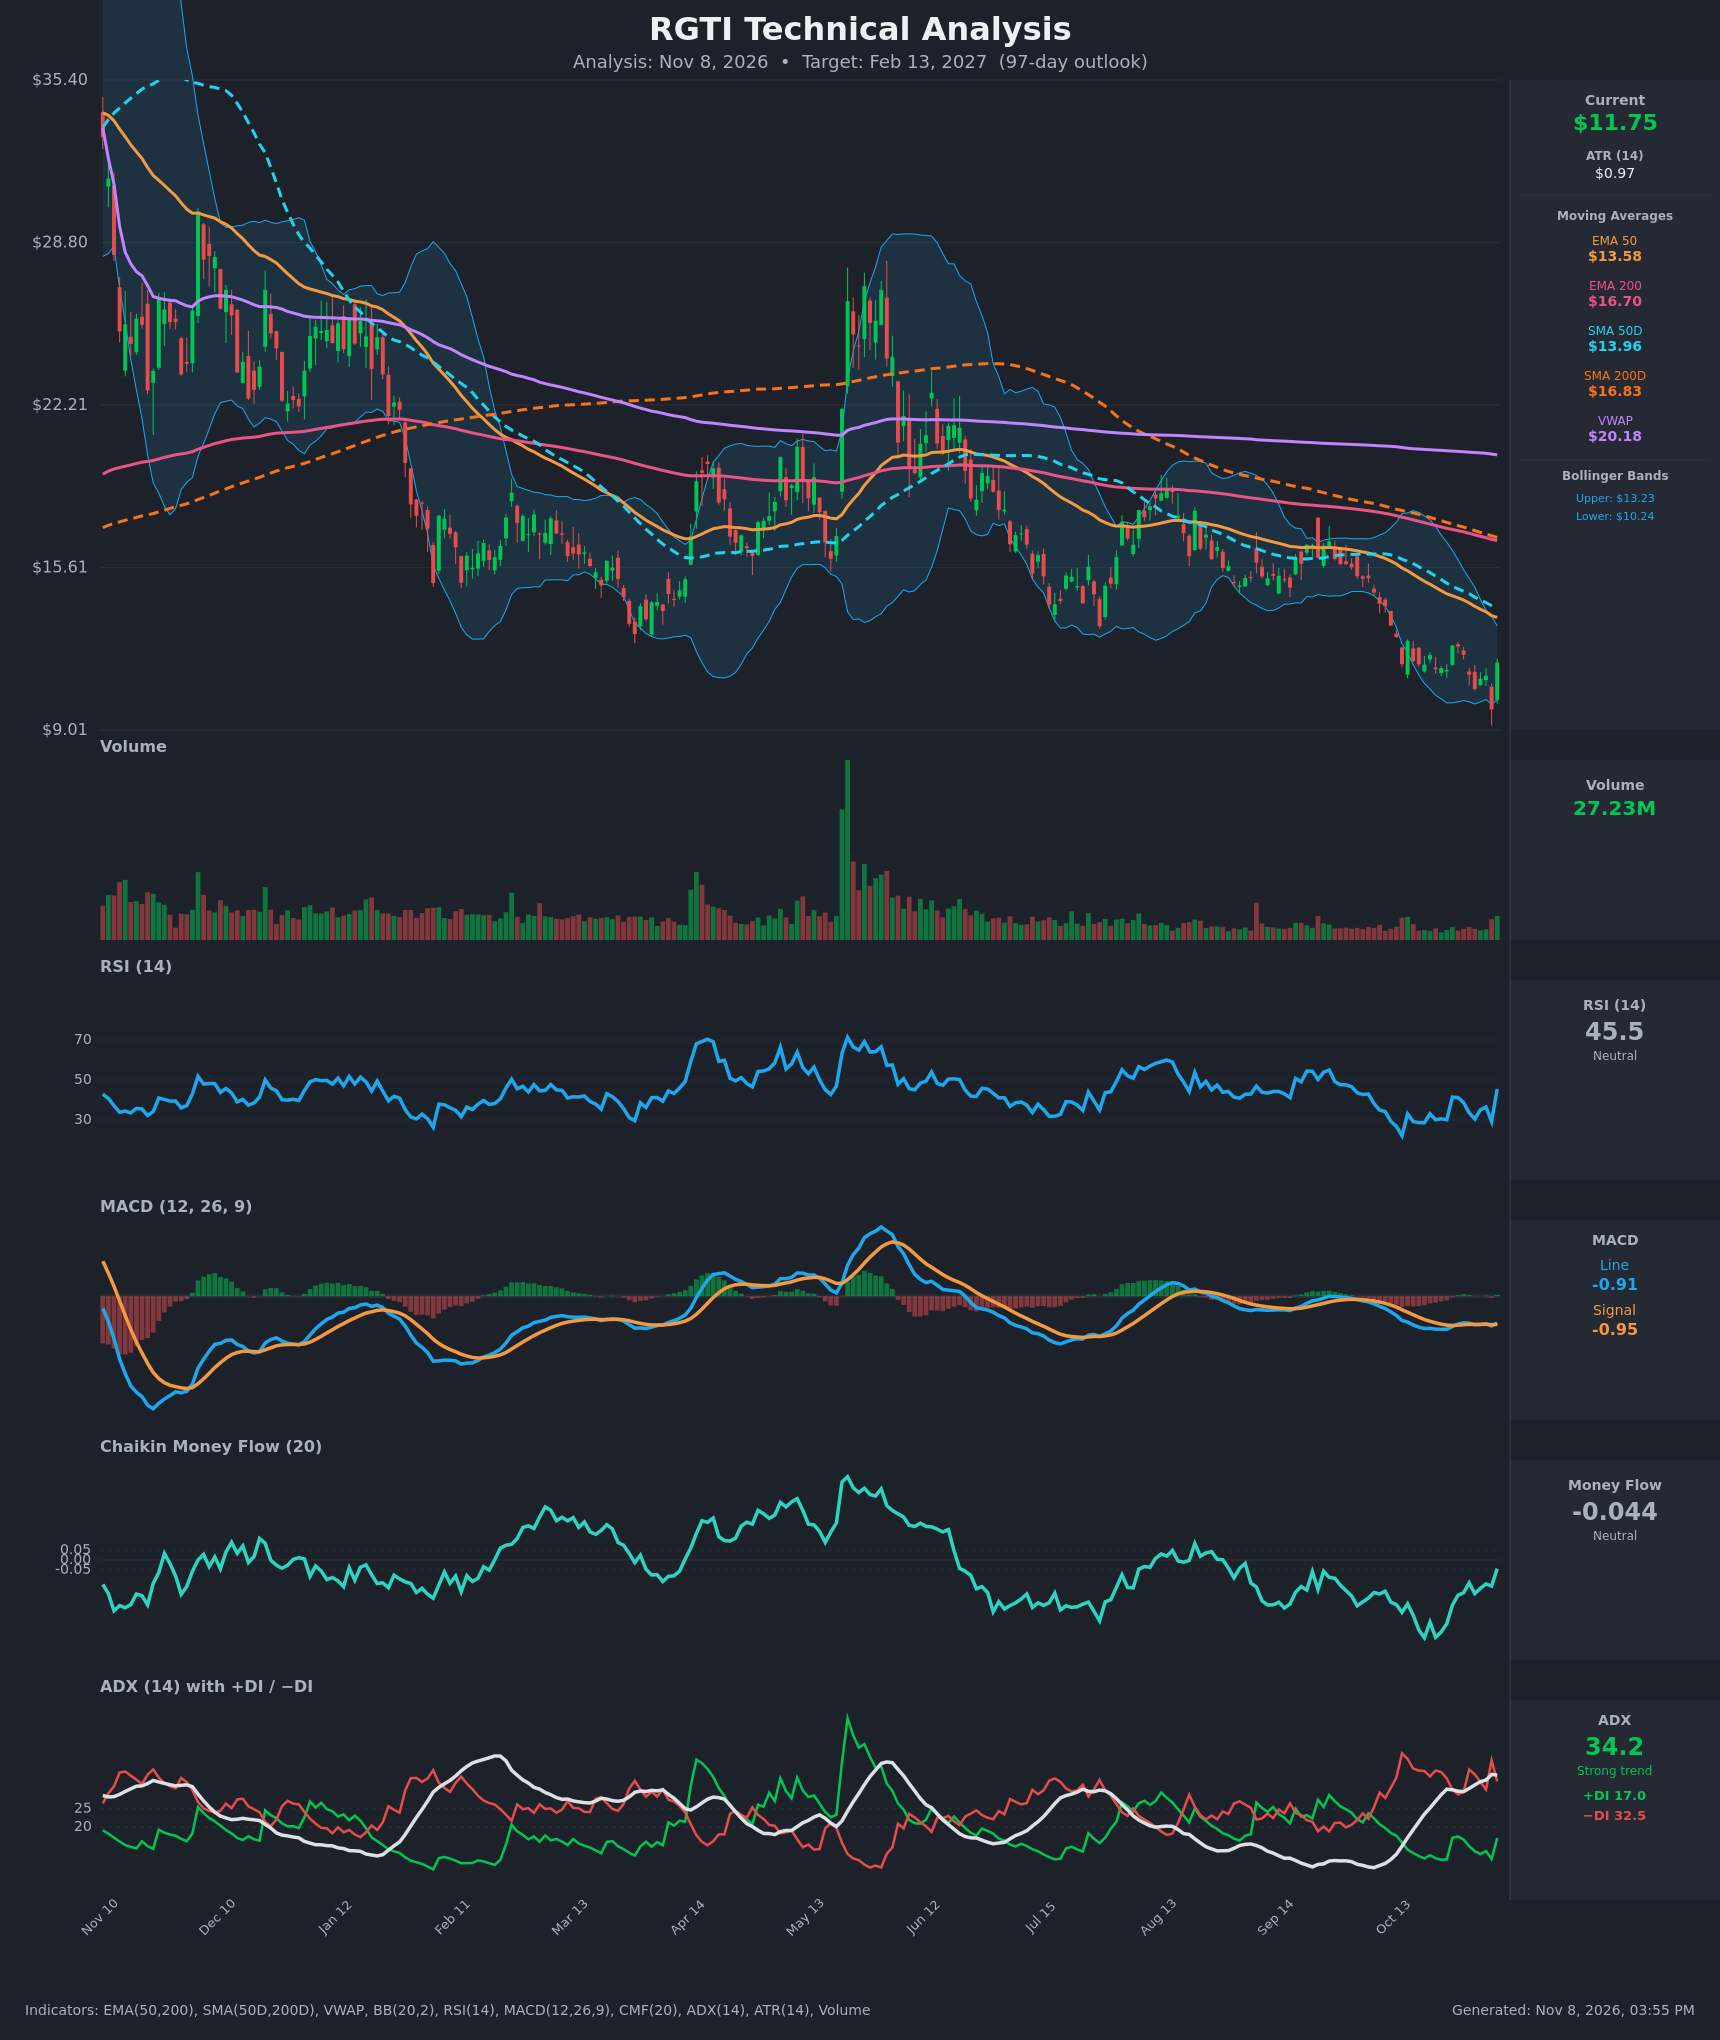
- RSI (14): 45.53. It bounced sharply from 29.2 (Nov 5) after repeatedly touching the ~28-30 oversold zone in late October. Momentum is recovering, but the RSI has not cleared 50, and 50 has capped it during this downtrend. [Neutral]
- 20 EMA: The 20 EMA is not supplied. Using the EMA 50 at $13.58 as the nearest dynamic reference, price at $11.75 is about 13% below it. The EMA 50 is falling every bar and sits below the EMA 200 ($16.70), so overhead averages act as resistance. [Bearish]
- MACD: Line -0.9105 is barely above Signal -0.9548, a marginal bullish crossover on Nov 6 with a histogram of about +0.04. Both lines are deeply negative and below zero. The cross is tiny and unconfirmed, and it comes from a one-day 19% bounce. [Neutral]
- Bollinger Bands (20): Upper $13.23, lower $10.24, so the midline is about $11.73 and price sits right at it. Price bounced from a lower-band breach (the $9.85 close was below the lower band) back to the midline. The bands are tilted downward, which fits a persistent downtrend. [Neutral]
- CMF (20): -0.044, inside the neutral band but still negative. It has improved from -0.39 (Oct 20) and is trending up. Selling pressure is easing, but there is no accumulation yet. [Neutral]
- ADX (14): 34.2 and rising, with -DI 32.5 above +DI 17.0. This is a strong, established downtrend. +DI has only briefly lifted from its lows, and bears remain firmly in control. [Strong Trend – Bearish]
- Volume: 27.23M on the bounce day, higher than the recent muted volume. This is a decent up-volume reversal bar, but it is far below the spikes seen on the major rallies (e.g. May). One bar is not enough to confirm a trend change. [Mildly Bullish / Unconfirmed]
DIVERGENCES & TRENDS
- Death cross in place: SMA50D ($13.96) is below SMA200D ($16.83), and EMA50 ($13.58) is below EMA200 ($16.70). Both gaps are still widening, which confirms a long-term downtrend.
- Price vs VWAP: Price at $11.75 is far below VWAP at $20.18, which shows sustained distribution over the period.
- Possible bullish divergence: The RSI low on Nov 5 (29.2) was only marginally below the late-October lows (28.6) while price made a lower low, and CMF has been improving since Oct 20. This hints at fading selling pressure, but it is not a clean divergence.
- MACD: It is flattening near -0.9 and has crossed the Signal line by a hair. This suggests the downside momentum is stalling, not that a reversal is confirmed.
- ADX: It is rising from the mid-20s to 34 while -DI dominates, so the trend is strengthening to the downside.
- Price structure: The series of lower highs and lower lows since the May spike (~$28) is intact. The last bounce is still well below every major moving average.
CHART PATTERNS
- Descending channel / Bullish Falling Wedge (possible): Since the May peak, price has made lower highs and lower lows with narrowing volatility. If it resolves upward through the $13.2-13.6 zone, the wedge target is a retracement to the $16-17 area (EMA/SMA 200). So far there is no breakout, so this is only a potential pattern.
- Bearish Flag / Pennant (continuation): After the drop from about $15.5 to $11, price has been consolidating in a $9.85-$12.44 range. A close below about $9.85 would point to a measured move toward $8-9.
- Double Bottom (potential): The $9.85 low and the $10.67 Nov 2 low form a tentative base. It would need a break above $12.44 and then ~$13.2 to be valid.
- Net read: The trend-continuation reading dominates, because price is below all moving averages and ADX is strong.
POTENTIAL SCENARIOS
- Scenario 1: Bearish Trend Continuation — The bounce fades into the falling EMA 50 and the Bollinger midline, and sellers re-assert as -DI stays dominant. Price grinds lower in a bear flag breakdown. Trigger: rejection at $12.44-$13.2 and a close below $10.24. Target: $9.00-$10.40, with an extension to $8.50. Invalidation: weekly close above $13.60 (EMA 50 / SMA50D). (50% probability)
- Scenario 2: Bullish Reversal / Wedge Breakout — The oversold bounce becomes a base (double bottom / falling wedge), the MACD cross holds, and CMF turns positive. Trigger: close above $13.23-$13.60 on rising volume. Target: $15.50-$16.80. Invalidation: close below $9.85. (28% probability)
- Scenario 3: Neutral Range — Price chops between $9.85 and $13.2 as volatility compresses, and the trend strength fades. Trigger: ADX rolls over below 25 with price holding the Bollinger midline. Target: $11-$12.50. Invalidation: a close outside the $9.85-$13.60 range. (22% probability)
PRICE TARGETS
Range width check: $12.50 - $9.00 = $3.50, or 29.8% of $11.75. That falls within the 18-30% guidance for a 61-180 day timeframe and is much wider than a short-term range.
- Target Price: $10.40 (97 days, Feb 13, 2027)
- Expected Range: $9.00 to $12.50
- Key Levels: Support at $9.85, Resistance at $13.23
OVERALL BIAS
OVERALL BIAS: BEARISH - ADX at 34 with -DI far above +DI, price below every major moving average (death cross intact), and a weak bounce into falling resistance favor continuation lower. Easing CMF and a marginal MACD cross limit conviction, and a break above $13.60 would invalidate the call.
This is educational analysis and not financial advice.