RSG 48-day bullish forecast — Nov 10, 2026
- Bias: Bullish
- Timeframe: 48 days (made Nov 10, 2026, target date Dec 28, 2026)
- Price at analysis: $246.00
- Price target: $253.00
- Expected range: $233.00 – $268.00
- Result: Pending — graded after the close on Dec 28, 2026
Get a free AI analysis of RSG today
Analysis
TECHNICAL INDICATORS
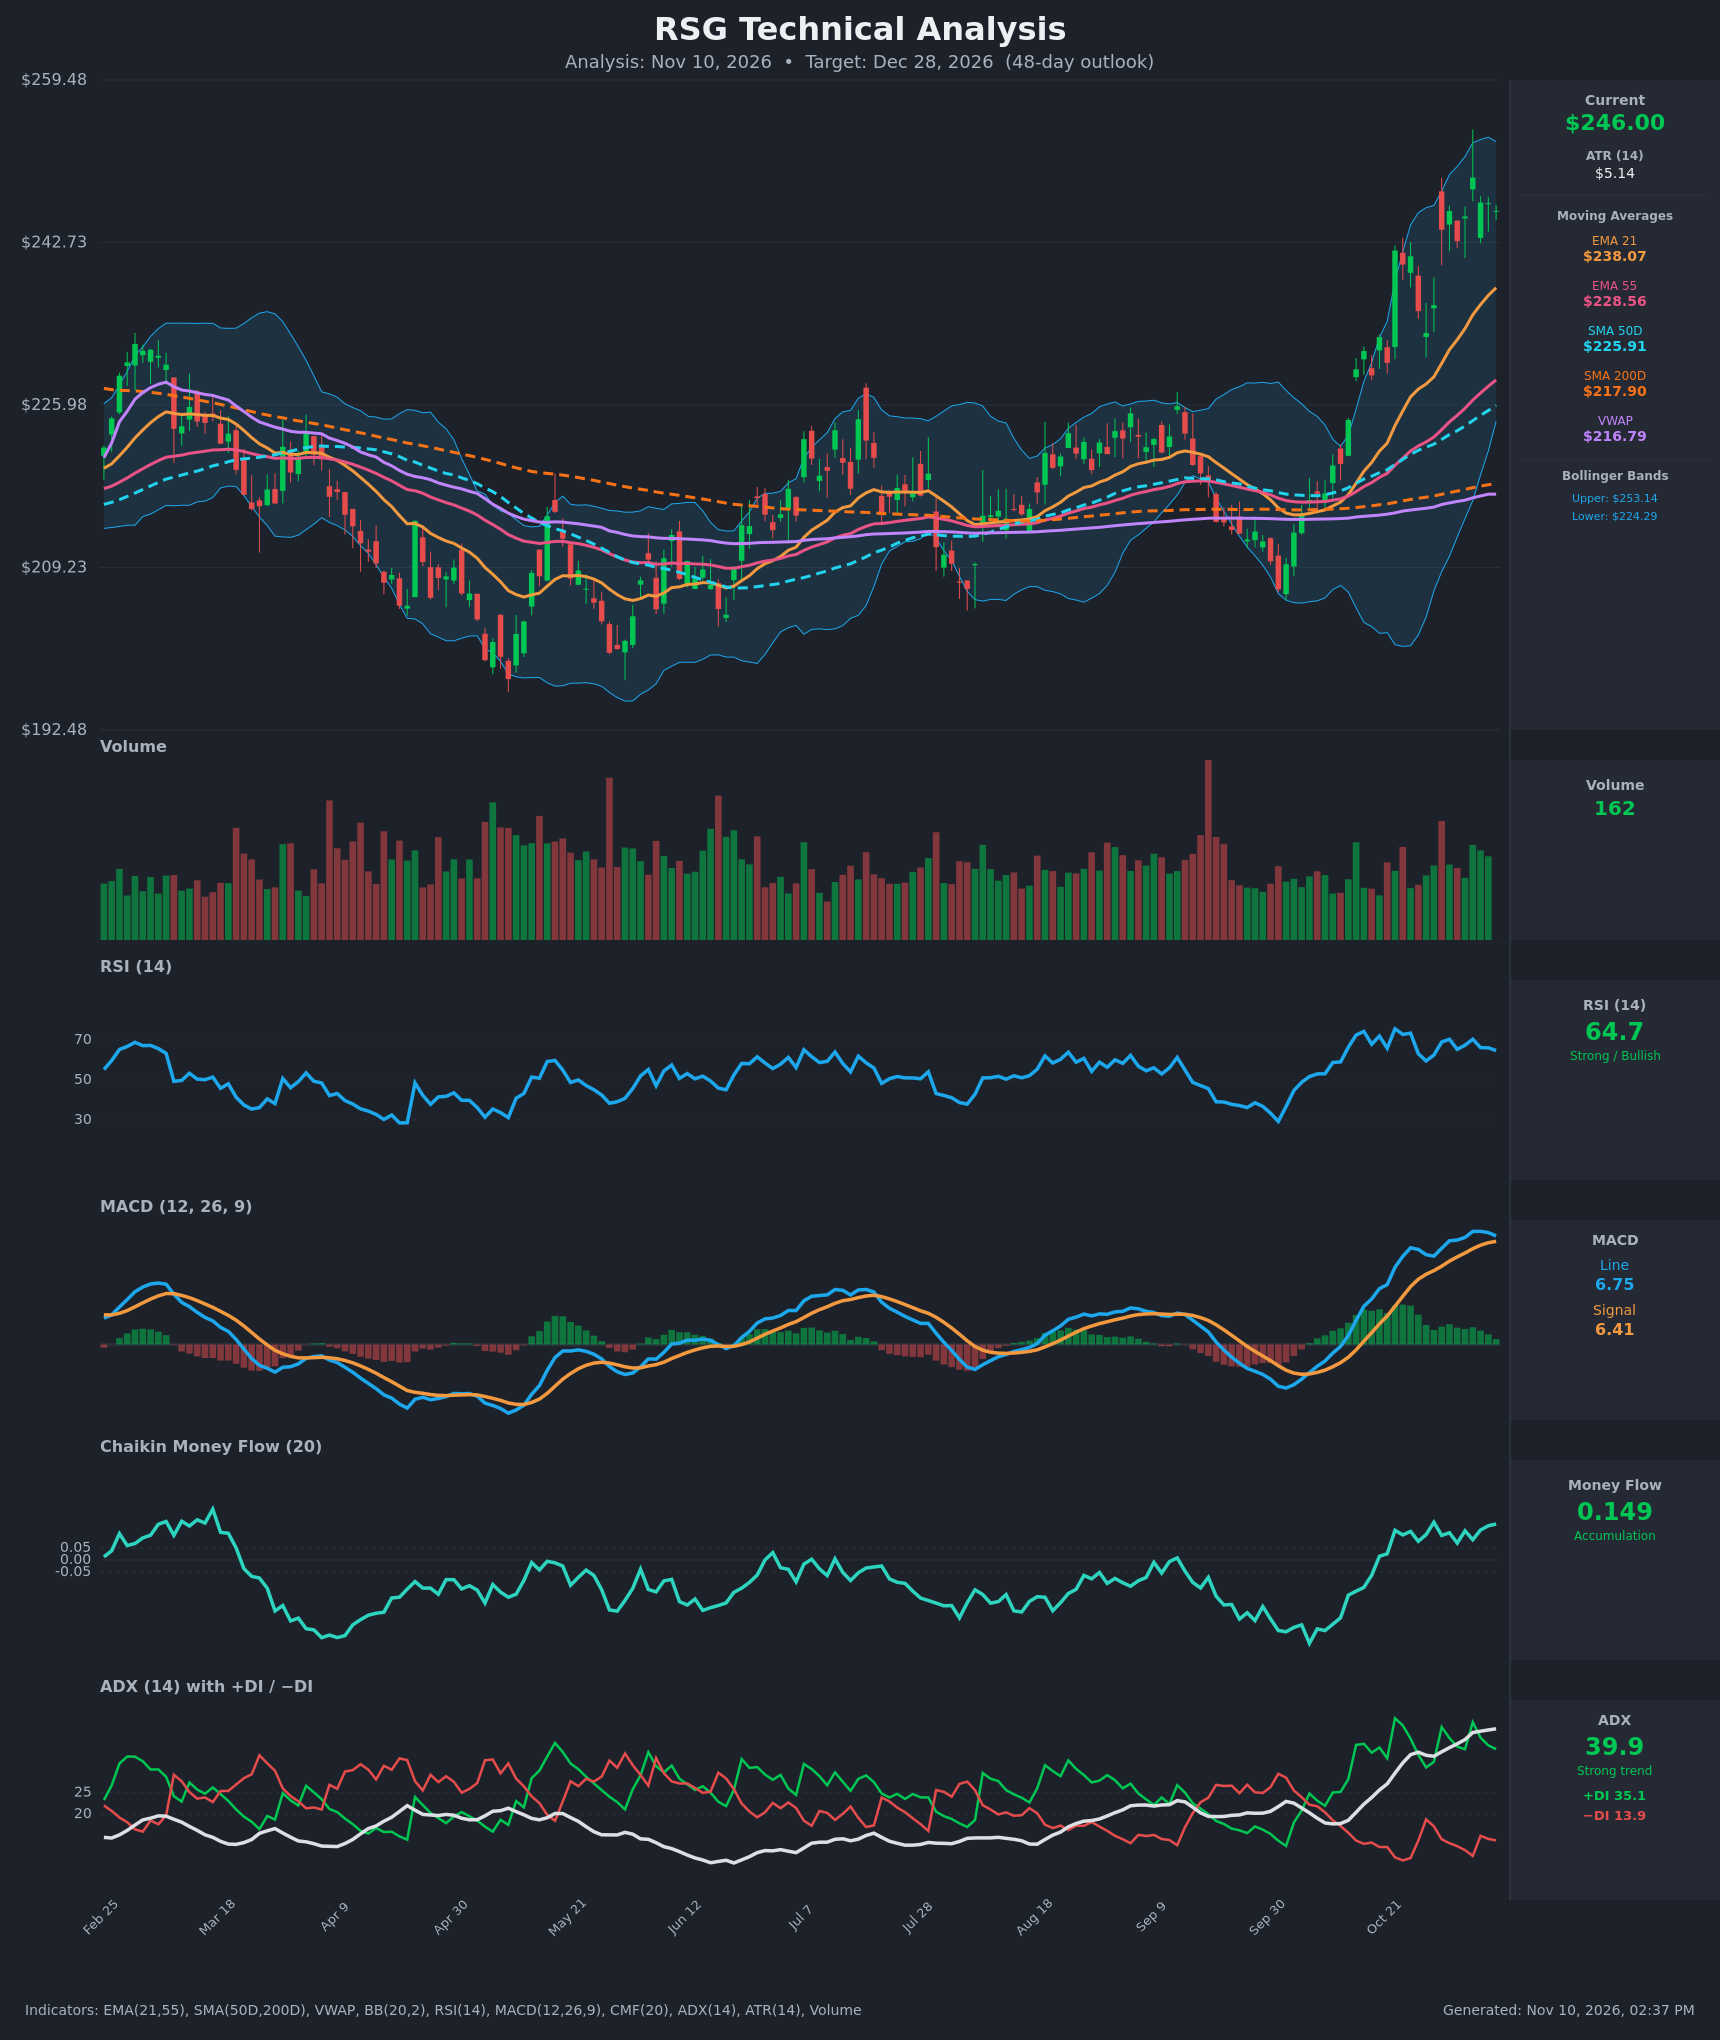
- RSI (14): 64.7, down from 70.4 on Nov 5 and 75.6 on Oct 22. It is in strong-bullish territory but below 70, so it is not overbought. Momentum is cooling slightly while price holds near highs. [Bullish]
- 20 EMA (EMA 21): $238.07, with price about 3.3% above it. EMA21 is rising steeply and sits well above EMA55 ($228.56), SMA50D ($225.91) and SMA200D ($217.90). The EMA21 is the first dynamic support on any pullback. [Bullish]
- MACD: Line 6.747 vs signal 6.410, so the histogram is positive at about +0.34. The histogram peaked near +0.87 in late October, so the gap is narrowing. The line is still above the signal and well above zero, with no bearish cross yet. Momentum is positive but decelerating. [Bullish]
- Bollinger Bands (20): Upper $253.14, lower $224.29, so price at $246 sits in the upper third of the bands. The bands have expanded sharply, and the last candles are walking the upper half without a decisive break above. [Bullish]
- CMF (20): 0.149, well above +0.05 and sustained positive since mid-October (0.07-0.16). This is consistent accumulation backing the rally. [Accumulation]
- ADX (14): 39.9 and rising, with +DI at 35.1 and −DI at 13.9. +DI is firmly on top, which means a strong, mature uptrend. An ADX near 40 can also mean the trend is getting extended. [Strong Trend + Bullish]
- Volume: 162, roughly average. Recent green bars are decent and there was heavy volume on the breakout leg, but no volume surge on the latest push. [Neutral to mildly supportive]
DIVERGENCES & TRENDS
- Mild bearish RSI divergence: Price made a higher close on Nov 5 ($249.42), but RSI peaked at only 70.4 versus 75.6 on Oct 22. The MACD histogram is also fading from its late-October peak. This points to slowing momentum rather than a reversal.
- No MACD or DI crossover: MACD remains above its signal line. +DI is far above −DI, and −DI has been compressed in the 10-15 range.
- Moving-average structure is fully bullish: EMA21 > EMA55 > SMA50D > SMA200D. SMA50D ($225.91) has crossed above SMA200D ($217.90), a golden cross that is now established. Price is above VWAP ($216.79) by about 13%, which is extended against anchored VWAP.
- CMF trend: CMF has climbed from deeply negative in September to +0.15, a big shift from distribution to accumulation that confirmed the breakout.
- ADX trend: ADX has risen from below 20 in the summer range to nearly 40. This marks a transition from a range to a strong trend.
CHART PATTERNS
- Breakout from a long base (bullish reversal context): From June to early October, price built a broad range and rounded base between roughly $205 and $230. The October gap and rally broke out of it, and the move is similar to a Bullish Triple Top/Double Bottom range breakout (the range-top breakout in the diagram).
- Bullish Flag / Pennant (continuation): After the sharp pole from about $230 to $249, price has been consolidating in a tight $233-$250 band with higher lows. This resembles the Bullish Flag or Pennant continuation pattern. A measured move (pole of about $19 added to the breakout around $250) projects toward $265-$270.
- Caveat: The flag is not fully resolved. A confirmed break above about $250-$255 would be needed to validate the target, and the flag fails if price closes below about $233.
POTENTIAL SCENARIOS
- Scenario 1: Bullish Flag Breakout Continuation — Price breaks the consolidation highs and resumes the trend, supported by positive CMF, +DI dominance and a MACD still above signal. Trigger: daily close above about $250-$253 (upper Bollinger Band and recent highs) on rising volume. Target: $258-$265, with an extension toward $268. Invalidation: daily close below $233. (55% probability)
- Scenario 2: Neutral Consolidation Near Highs — The fading RSI and MACD histogram lead to digestion, with price oscillating between EMA21 and the recent highs while the moving averages catch up. Trigger: repeated failures at $250-$255 with support holding near $238-$240. Target: $238-$250 range. Invalidation: close above $255 (bullish) or below $233 (bearish). (25% probability)
- Scenario 3: Bearish Mean-Reversion Pullback — The extended price (well above VWAP, SMA50D and SMA200D) and the mild RSI divergence trigger a deeper retracement. Trigger: close below the EMA21 ($238) and a MACD bearish cross. Target: $226-$230 (SMA50D and EMA55 zone). Invalidation: reclaim of $246-$250 on volume. (20% probability)
PRICE TARGETS
For the 48-day timeframe (to about Dec 28, 2026):
- Target Price: $253.00 (about +2.8%, reflecting a trend continuation that is tempered by extension near the upper band)
- Expected Range: $233.00 to $268.00 (width $35, about 14.2% of current price, which fits the 30-60 day guidance of 12-18%)
- Key Levels: Support at $238.07 (EMA21), with deeper support at $233 and $228.56 (EMA55). Resistance at $255.00 (recent swing high and upper Bollinger Band zone around $253).
OVERALL BIAS
OVERALL BIAS: BULLISH - Price is above every moving average with a golden cross in place. ADX is near 40 with +DI far above −DI, CMF is sustained in accumulation, and the pattern resembles a bullish flag continuation. The fading RSI and MACD histogram argue for a modest target rather than an aggressive one.
This is educational analysis and not financial advice.