RSG 45-day bullish forecast — Nov 16, 2026
- Bias: Bullish
- Timeframe: 45 days (made Nov 16, 2026, target date Dec 31, 2026)
- Price at analysis: $255.10
- Price target: $261.00
- Expected range: $239.00 – $277.00
- Result: Pending — graded after the close on Dec 31, 2026
Get a free AI analysis of RSG today
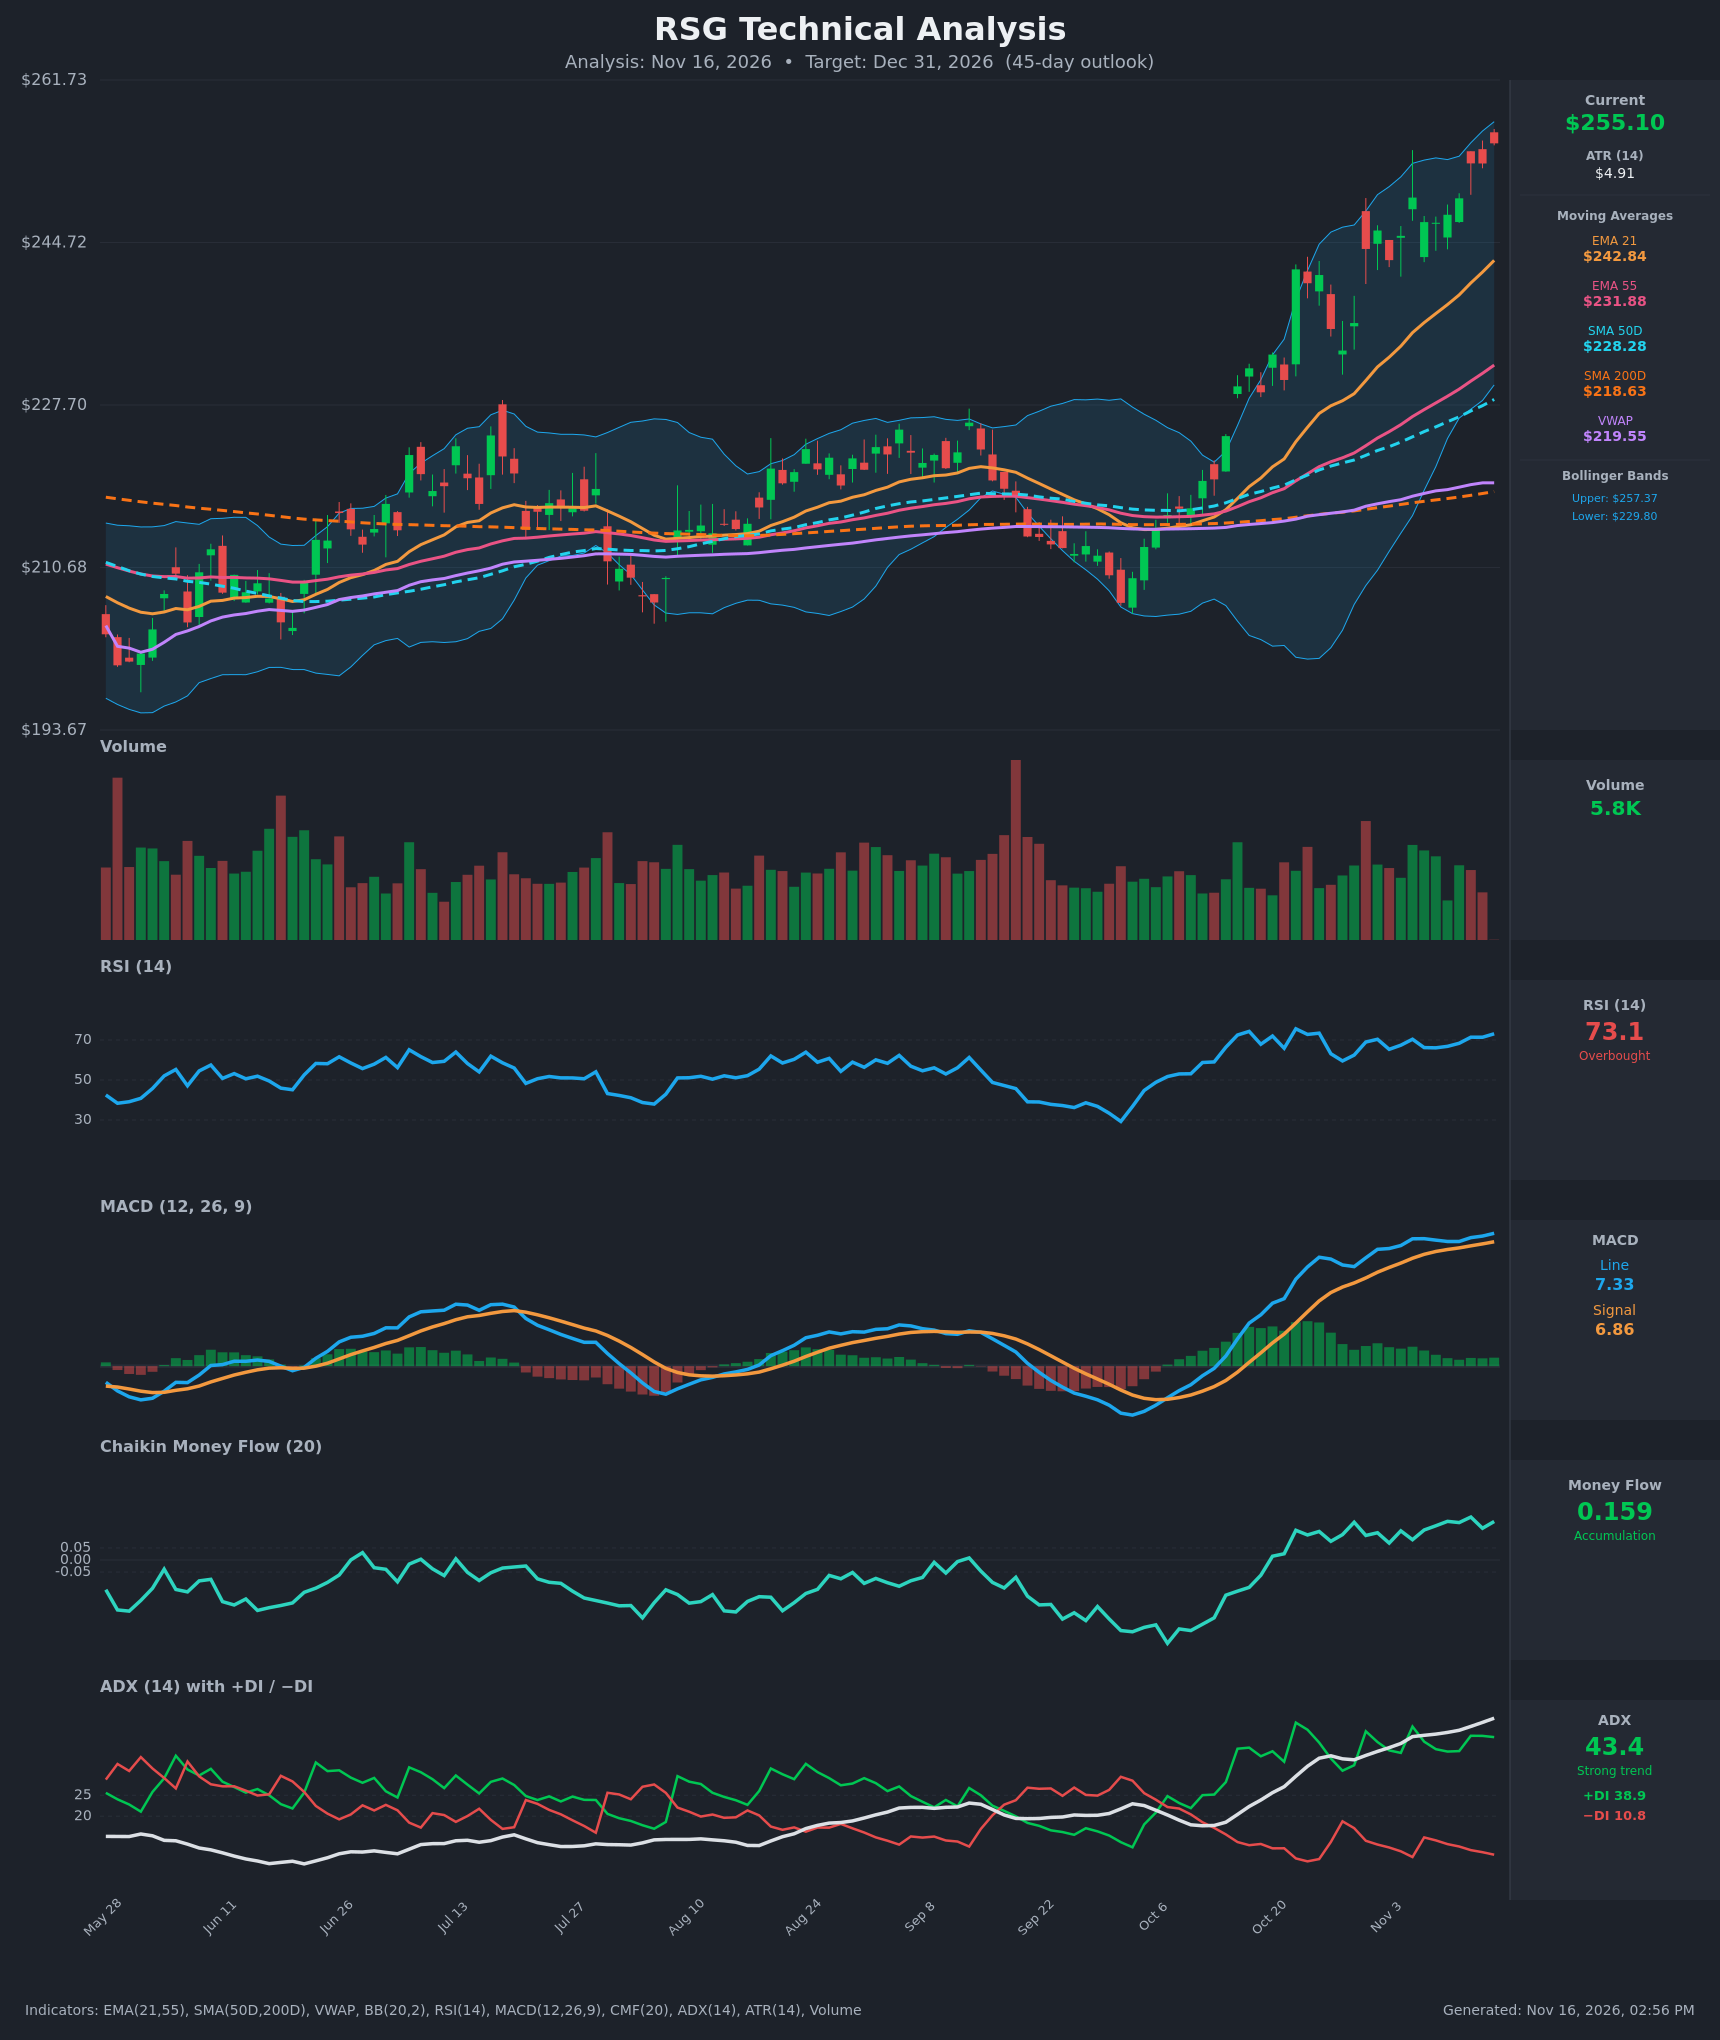
Analysis
TECHNICAL INDICATORS
- RSI (14): 73.1, overbought and at the highest reading of the last 15 bars, up from 59.5 on Oct 28. Momentum is still rising, but the reading is stretched and prone to a pause. [Bullish]
- 20 EMA: The EMA 21 is $242.84 and rising steadily. Price at $255.10 is about 5% above it, so the EMA is dynamic support on any pullback. The EMA 55 ($231.88) is stacked below it. [Bullish]
- MACD: The line (7.33) is above the signal (6.86) and both are rising. The histogram is small and positive (~+0.47), widening slightly after a mid-November flattening. There is no bearish crossover. [Bullish]
- Bollinger Bands (20): The upper band is $257.37, the lower band is $229.80 and the midline is about $243.6. Price sits in the top 8% of the band range and is walking the upper band after a wide expansion. This usually signals trend strength, but it also raises the risk of a pause or a revert toward the midline. [Bullish]
- CMF (20): 0.159, well above +0.05 and sustained positive since mid-October. This shows genuine accumulation behind the rally, not just thin price movement. [Accumulation]
- ADX (14): 43.4 and rising, a very strong trend. +DI is 38.9 against −DI at 10.8, so bulls are firmly in control. ADX above 40 can mark a mature trend, but there is no sign of exhaustion yet. [Strong Trend – Bullish]
- Volume: The reading is 5.8K, which looks low or partial. Recent up days show average-to-slightly-above-average volume, with a notable spike in late October. The latest candle is a small red, upper-wicked bar at the high, a minor sign of hesitation. [Neutral to mildly supportive]
DIVERGENCES & TRENDS
- No bearish divergence: RSI (73.1), MACD (7.33) and price are all making new highs together, so there is no momentum divergence yet.
- Moving-average structure: Price is above the EMA 21, EMA 55, SMA 50D ($228.28), SMA 200D ($218.63) and VWAP ($219.55). The SMA 50D has been above the SMA 200D throughout the data (golden cross already in place), and the EMA 21 is above the EMA 55. Every trend filter is bullish.
- Extension: Price is about 16% above the SMA 200D and 12% above the SMA 50D. This is a stretched condition, so mean-reversion risk is elevated even though the trend is strong.
- RSI behavior: RSI has held 60-73 for about three weeks, which is typical of a strong trend regime. Overbought readings in trends often persist.
- Rate of change: The MACD histogram is no longer expanding quickly, so momentum acceleration has slowed even as price makes higher highs. This is a mild caution.
CHART PATTERNS
- Bullish flag / pennant continuation: After the sharp Oct 20-30 impulse, price consolidated in a roughly $233-$249 range with higher lows, then broke higher in November. This resembles the Bullish Flag Pattern in the reference diagram. The measured move (impulse of ~$30 from ~$212 to ~$242) points to higher levels of roughly $270+ over a longer horizon.
- Trend position: Price has broken out of a long base (May-Oct range of ~$205-$228), so the move is a multi-month breakout. There is no confirmed reversal pattern such as a double top or rising wedge. The nearest bearish risk would be a rising-wedge-style stall near the upper band.
- Near-term target: The upper Bollinger band and the chart high near $261.7 are the first resistance zone. The ATR of $4.91 suggests a $5 move can happen in a day or two.
POTENTIAL SCENARIOS
- Scenario 1: Bullish Trend Continuation — Strong ADX, positive CMF and the rising MACD keep the trend intact. Price digests the overbought condition with a shallow pullback toward $246-$249, then pushes higher. Trigger: a hold above $249 and a close above $261.7. Target: $261-$270. Invalidation: a daily close below the EMA 21 (~$243-$245). (52% probability)
- Scenario 2: Bearish Mean-Reversion Pullback — Extension from the moving averages and RSI above 70 trigger profit-taking, with price reverting to the Bollinger midline and EMA 21 area. Trigger: a close below $247 on rising volume and a MACD histogram turning negative. Target: $236-$243. Invalidation: a reclaim of $255 with strong volume. (33% probability)
- Scenario 3: Neutral Consolidation — Price chops between roughly $245 and $260 while the moving averages catch up. Trigger: ADX rolling over from the 40s and RSI falling back toward 60. Target: $248-$258. Invalidation: a break outside $243-$263. (15% probability)
PRICE TARGETS
- Target Price: $261.00 (45-day, ~Dec 31, 2026)
- Expected Range: $239.00 to $277.00 (width $38 = ~14.9% of current price, consistent with the 30-60 day guidance of ~12-18%)
- Key Levels: Support at $245.00 (prior consolidation highs and just above the rising EMA 21 at ~$242.84), Resistance at $261.70 (recent chart high and upper-band extension)
OVERALL BIAS
OVERALL BIAS: BULLISH - Every trend and flow indicator agrees: price is above all moving averages, ADX is 43 with +DI far above −DI, CMF is +0.16 and MACD is above its signal. Overbought RSI and the extension above the bands argue for a pullback along the way and limit upside to a modest gain.
This is educational analysis and not financial advice.