RSG 44-day bullish forecast — Nov 17, 2026
- Bias: Bullish
- Timeframe: 44 days (made Nov 17, 2026, target date Dec 31, 2026)
- Price at analysis: $256.05
- Price target: $260.00
- Expected range: $230.00 – $292.00
- Result: Pending — graded after the close on Dec 31, 2026
Get a free AI analysis of RSG today
Analysis
TECHNICAL INDICATORS
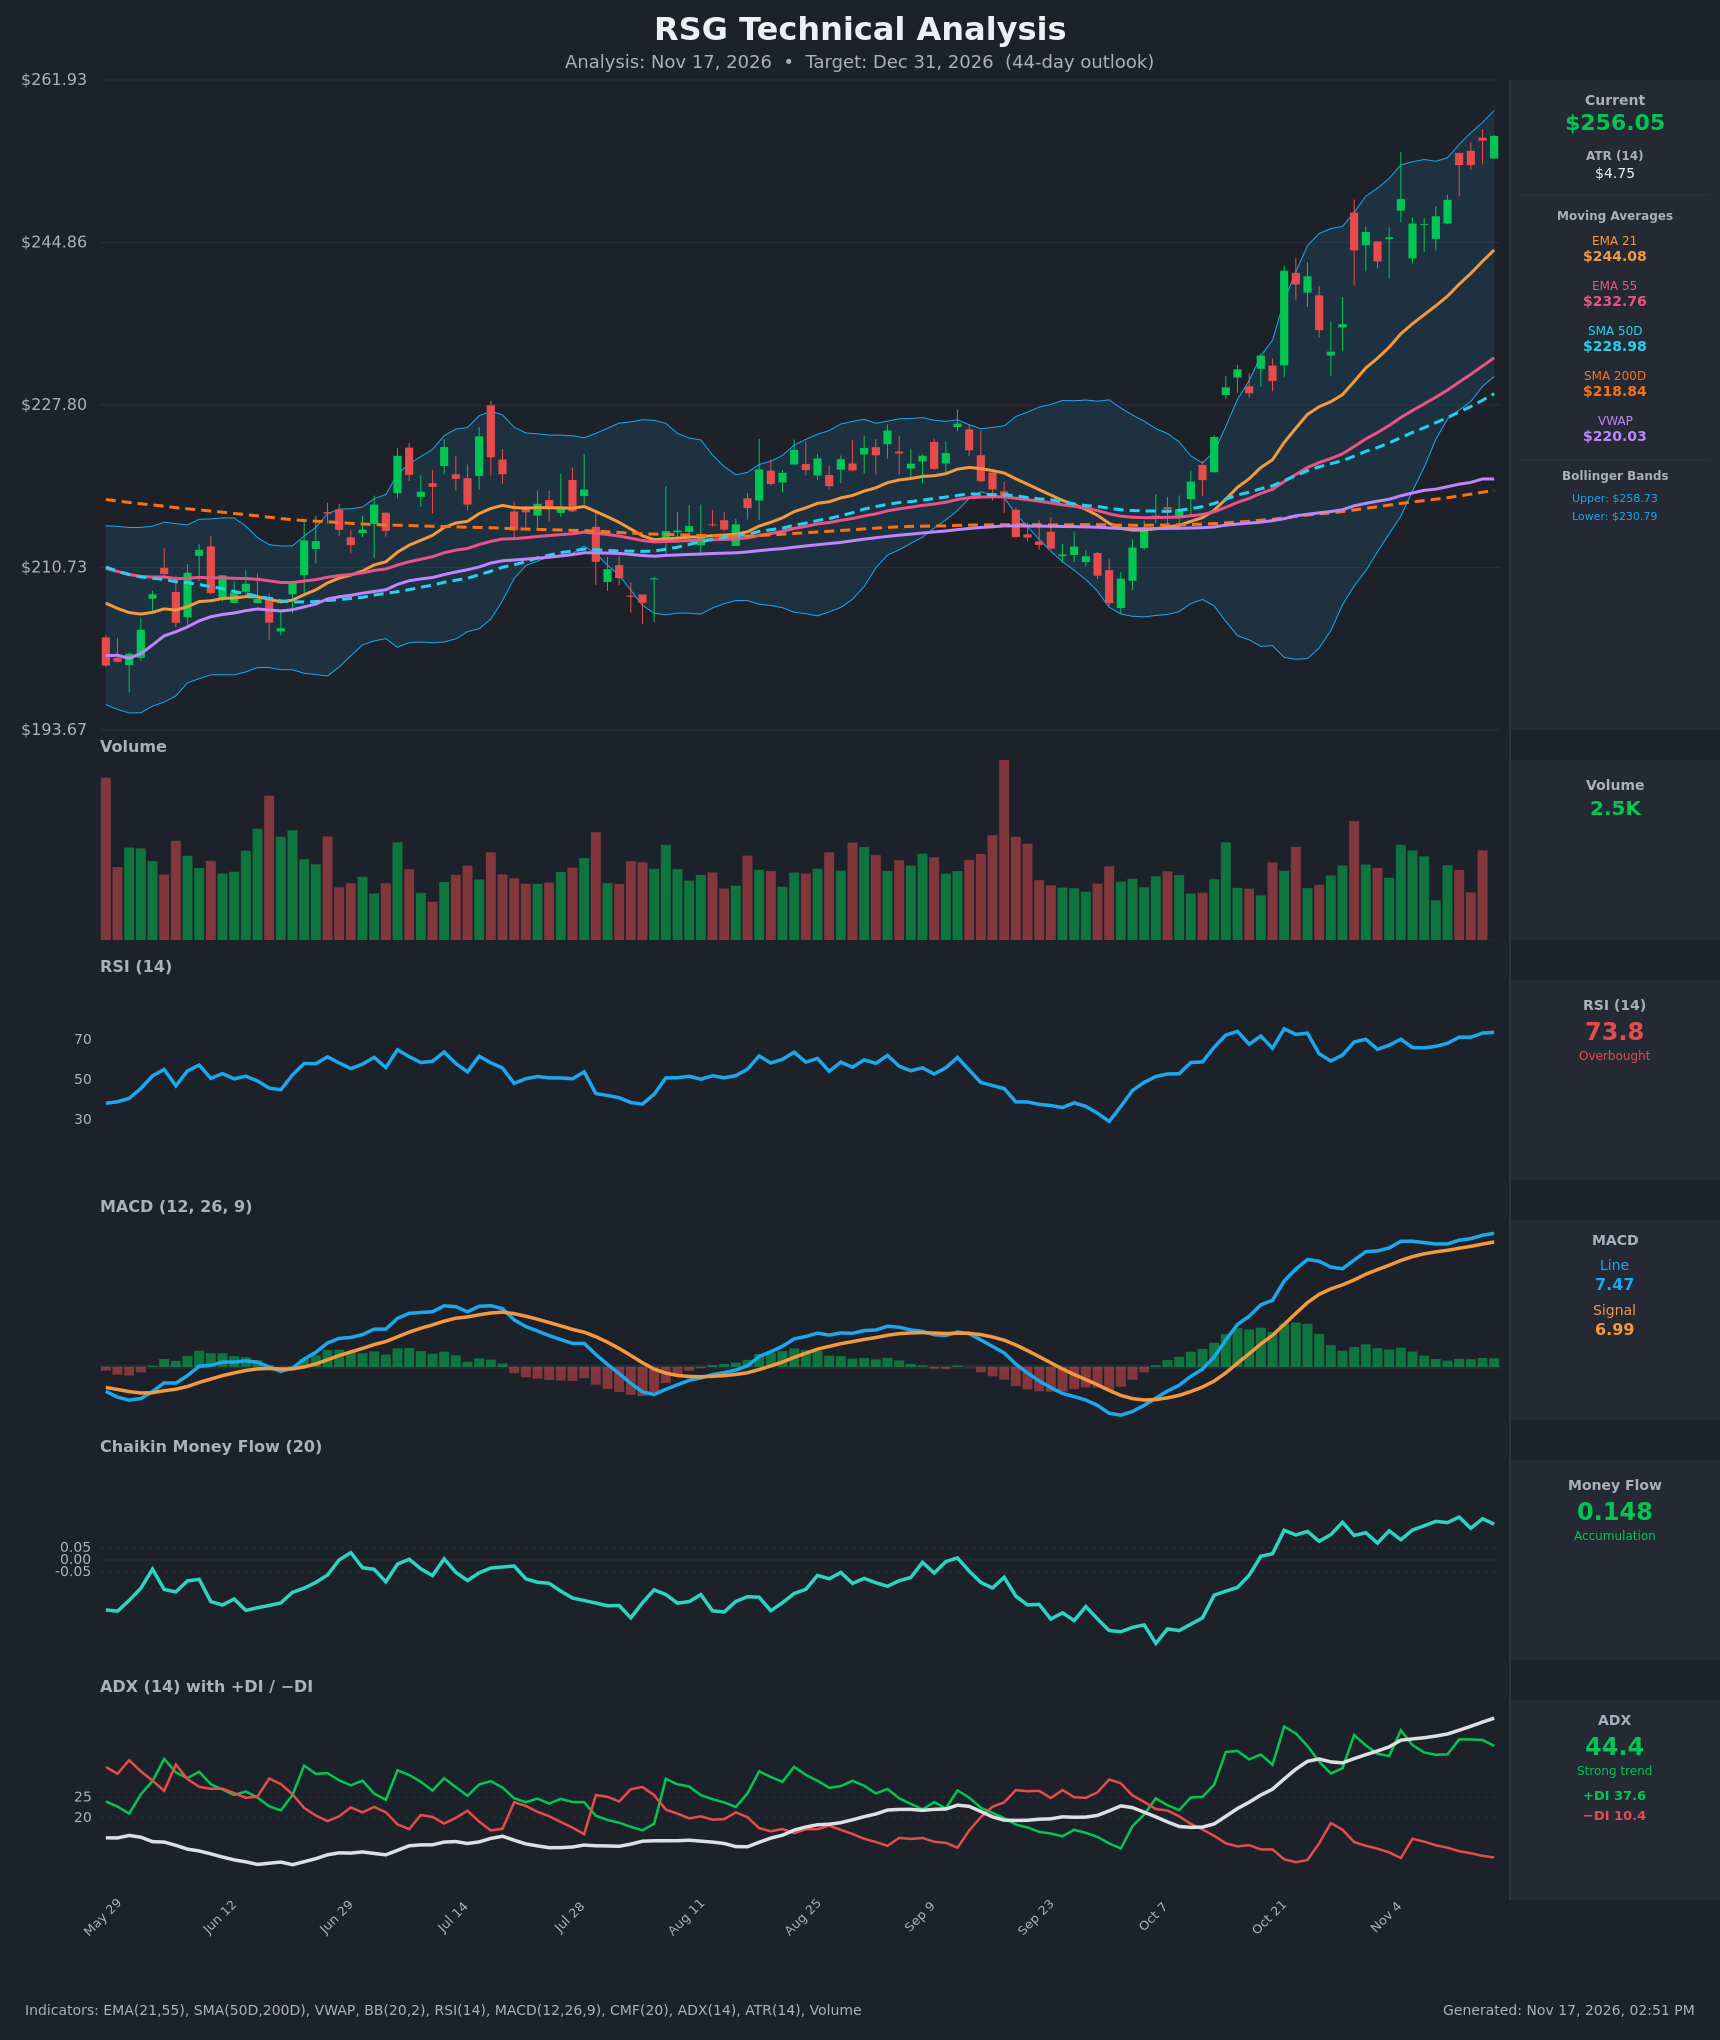
- RSI (14): 73.84, overbought and still edging higher (71.4 → 73.5 → 73.8 over the last three bars). Momentum is strong, but the reading is stretched and raises the odds of a pause or pullback. [Bullish]
- Moving Averages: Price ($256.05) is above every average, so each acts as support: EMA 21 ($244.08), EMA 55 ($232.76), SMA 50D ($228.98), SMA 200D ($218.84) and VWAP ($220.03). The stack is fully bullish (price > EMA 21 > EMA 55 > SMA 50D > VWAP > SMA 200D). The averages are widening, and SMA 50D has been above SMA 200D for the whole 15-bar window. Price sits about 4.9% above EMA 21 and about 16% above SMA 200D, which is extended. [Bullish]
- MACD: Line 7.47 is above signal 6.99, and both are positive and rising. The histogram is about +0.48 and has widened slightly over the last several bars after shrinking from its October peak. There is no bearish crossover. [Bullish]
- Bollinger Bands (20): Price is $256.05 against an upper band of $258.73 and a lower band of $230.79, so it is riding the upper band at roughly 90% of the band width. The bands are expanding, which signals a volatility-driven trend ("walking the band") rather than a reversal. Over 44 days it is still a stretched position that often resolves in consolidation. [Bullish]
- CMF (20): 0.148, clearly above +0.05 and holding in the 0.07–0.18 range for the last 15 bars. This is sustained accumulation, and it confirms the rally with real buying pressure. [Accumulation]
- ADX (14): 44.4 and rising, with +DI at 37.6 far above −DI at 10.4. This is a very strong, bull-controlled trend. ADX above 40 can also mean the trend is mature, so it warns of exhaustion risk even though it favors continuation. [Strong Trend + Bullish]
- Volume: 2.5K, with recent bars close to average and no obvious blow-off spike. Up days carry slightly more volume than down days, and there is no climactic volume signaling exhaustion. [Neutral-to-supportive]
DIVERGENCES & TRENDS
- There is no bearish divergence: price made a new high and RSI (73.8), MACD (7.47) and CMF (0.148) all made matching highs.
- RSI has held in the 65–74 band since mid-October, which is a bull-regime range rather than a reversal signal.
- The MACD histogram peaked in mid-October and then faded, but it has stabilized and is turning up again as the MACD line rises faster than the signal line.
- ADX has climbed from the low 20s (early October) to 44.4, and −DI has collapsed to about 10, so sellers have been largely absent.
- The EMA 21/55 bullish alignment has been in place since early October. SMA 50D is rising toward the price cluster, and SMA 200D is flat to slightly rising, which supports a long-term uptrend.
- The main caution is extension: price is far above its averages after a roughly 22% advance from the early October low (about $210).
CHART PATTERNS
- The stock broke out in October from a roughly five-month base between about $208 and $228. This resembles a rectangle or triple-bottom style consolidation resolving upward.
- The measured move from that range (about $20–28 of height added to the $228 breakout) points to about $248–256, so the objective has essentially been reached. Further upside now relies on trend momentum rather than a fresh pattern target.
- The recent staircase of higher highs and higher lows with shallow pullbacks is bullish continuation behavior. A bullish flag or pennant (reference diagram) could form as a pause. A flag breakout would project toward $270–280.
- If price stalls at $256–262 with lower highs, an ascending-wedge or double-top style reversal would be the warning pattern, with a pullback toward the EMA 21 area (about $244) as the first target.
POTENTIAL SCENARIOS
- Scenario 1: Bullish Trend Continuation — Price digests the overbought condition with a shallow consolidation, then grinds higher with the MAs rising beneath it. Trigger: a hold above $250 followed by a close above $262 (the chart high). Target: $270–$280. Invalidation: a daily close below $244 (the EMA 21). (50% probability)
- Scenario 2: Bearish Mean-Reversion Pullback — RSI above 70 and price at the upper Bollinger Band lead to profit-taking back toward the rising EMA 21 and the October breakout zone. Trigger: a rejection near $258–262 and a MACD histogram turn negative. Target: $240–$244, with a deeper test of $232 (the EMA 55). Invalidation: a close above $262 on strong volume. (30% probability)
- Scenario 3: Neutral Sideways Digestion — The stock consolidates above the EMA 21 and below the highs as the averages catch up. Trigger: repeated closes between $245 and $260 with falling ADX. Target: $248–$258. Invalidation: a break outside $244–$262. (20% probability)
PRICE TARGETS
- Target Price: $260.00 (44-day, 12.3% typical move ≈ $31.57)
- Expected Range: $230.00 to $292.00 (about 2x the typical move wide, shifted modestly up with the bullish bias)
- Key Levels: Support at $244.08, Resistance at $261.93
OVERALL BIAS
OVERALL BIAS: BULLISH - Price is above every moving average with ADX at 44.4, +DI far above −DI, a MACD above its signal line, and CMF showing sustained accumulation. The overbought RSI and stretched price argue for a modest target and a possible pullback toward $244 along the way.
This is educational analysis and not financial advice.