RGTI 6-day bearish forecast — Nov 15, 2026
- Bias: Bearish
- Timeframe: 6 days (made Nov 15, 2026, target date Nov 20, 2026)
- Price at analysis: $9.62
- Price target: $9.35
- Expected range: $9.05 – $10.15
- Result: Pending — graded after the close on Nov 20, 2026
Get a free AI analysis of RGTI today
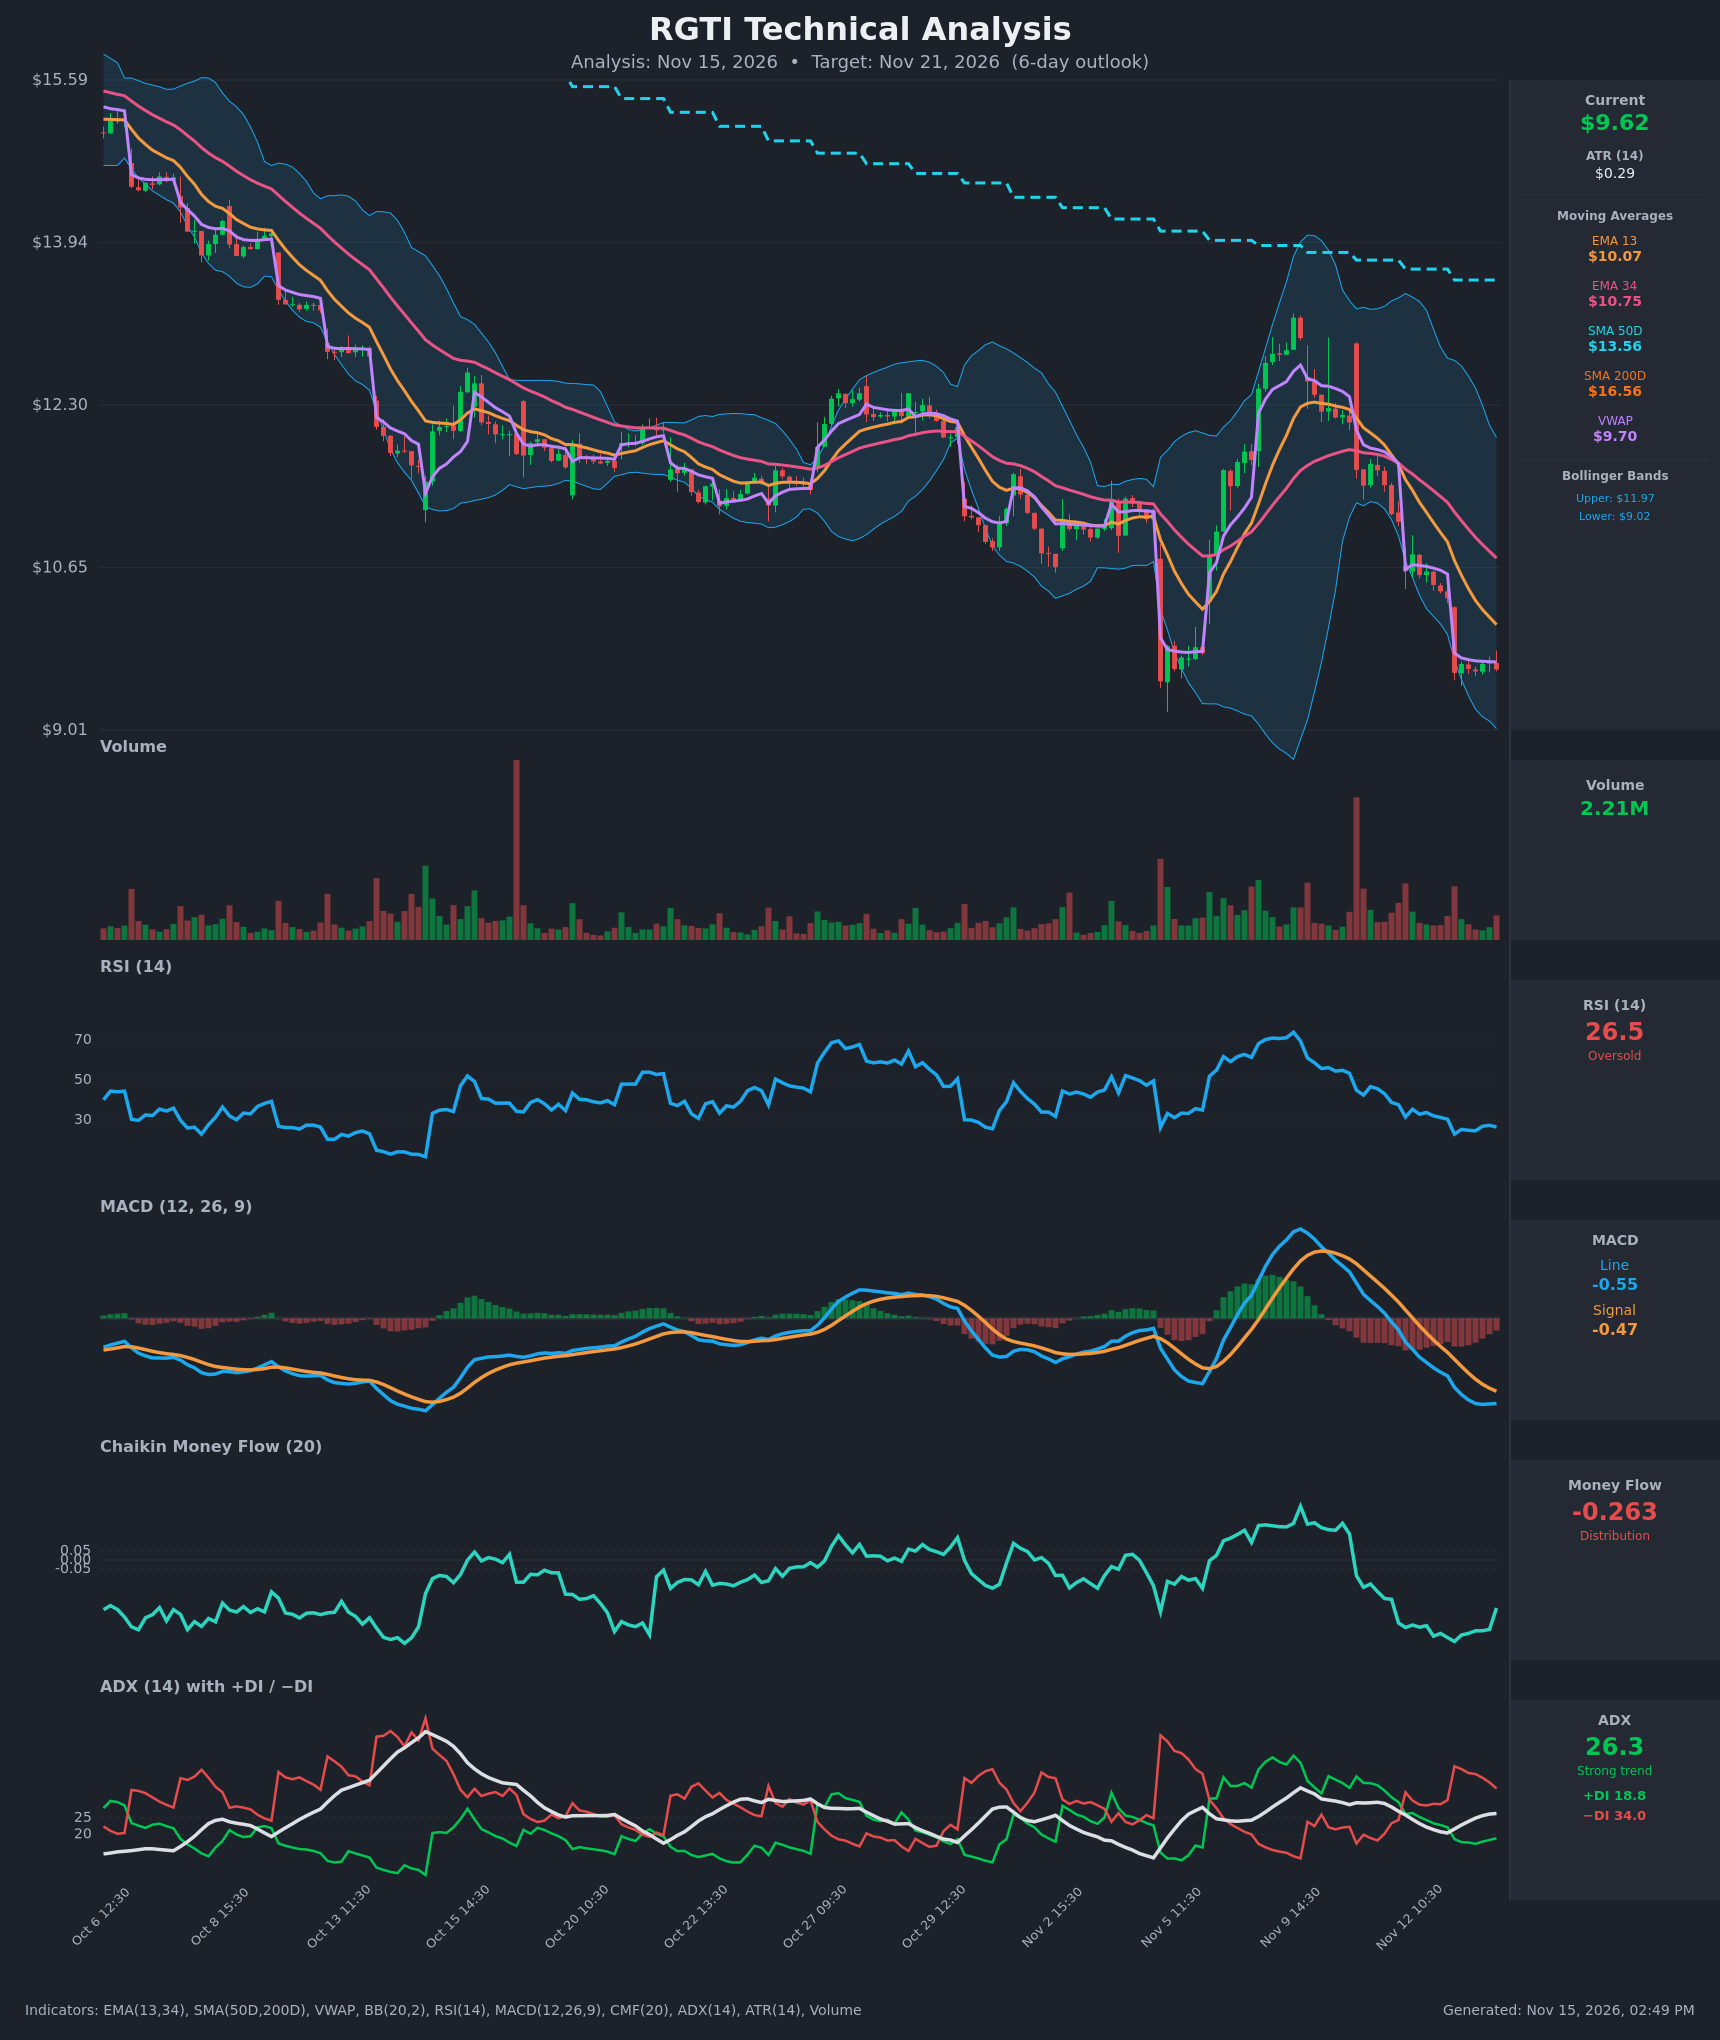
Analysis
TECHNICAL INDICATORS
- RSI (14): 26.48, oversold and near the lows of the recent range (it touched 22.9 on Nov 13 at the open). It has been under 30 for most of the last few sessions, so downside momentum is still intact, but selling is stretched. [Bearish]
- 20 EMA: The chart gives EMA 13 at $10.07 and EMA 34 at $10.75, so I use EMA 13 as the short-term proxy. Price at $9.62 is well below both, and both are sloping down. EMA 13 is under EMA 34 and the gap is widening, so the EMAs act as overhead resistance. [Bearish]
- MACD: Line -0.550 is below signal -0.471, and the histogram is negative at about -0.08. The bearish crossover occurred around Nov 12 and both lines are negative. The line has flattened over the last few bars (-0.556, -0.553, -0.550), which hints at momentum stabilizing, but there is no bullish cross yet. [Bearish]
- Bollinger Bands (20): Upper $11.97, lower $9.02. Price at $9.62 is in the lower quarter of the bands, about $0.60 above the lower band. It is not walking the lower band directly, and the bands are wide after the earlier spike. That leaves room for a mean-reversion bounce toward the midline (~$10.5), though the trend is down. [Neutral]
- CMF (20): -0.263, well below -0.05, which shows sustained distribution. It has ticked up from -0.381 to -0.263, so selling pressure is easing slightly but is still heavy. [Distribution]
- ADX (14): 26.3 and rising, above the 25 threshold. −DI 34.0 is far above +DI 18.8, so bears are in control of a strong downtrend. [Strong Trend – Bearish]
- Volume: 2.21M, ordinary and well below the spikes seen on the big down days (Nov 4–5 and Nov 11–12). The latest decline came on moderate volume with no capitulation spike, so there is no clear exhaustion signal. [Neutral to mildly bearish – no capitulation]
DIVERGENCES & TRENDS
- Price made a lower low against the late-October and early-November lows, while RSI is at similar oversold levels (~25–27) as the Nov 13 open reading. There is no clear bullish RSI divergence yet.
- MACD is flattening while price slips, an early sign of momentum deceleration but not a divergence.
- CMF is recovering slightly from its low (-0.447 to -0.263) while price is flat to lower, a minor positive divergence that needs confirmation.
- Moving averages are fully bearish: price < VWAP ($9.70) < EMA 13 ($10.07) < EMA 34 ($10.75) < SMA50D ($13.56) < SMA200D ($16.56). SMA50D is already below SMA200D, so the death cross is in place.
- Price has been consolidating in a tight $9.59–$9.69 band for the last 6 hourly bars after the gap down on Nov 13, which is a small pause under VWAP.
- The Nov 5–9 rally to ~$13 failed and reversed in full, a lower high within the larger downtrend.
CHART PATTERNS
- Bearish Pennant / Bearish Flag (continuation): The tight sideways drift at $9.60–$9.70 after the sharp drop from $10.34 to $9.59 resembles a small bearish flag or pennant. The measured move implies a break toward ~$9.0–$9.2, which coincides with the lower Bollinger Band at $9.02.
- Larger structure: A series of lower highs and lower lows since mid-October is a descending channel, consistent with a persistent downtrend. A bullish falling wedge is possible if momentum fades, but there is no breakout confirmation.
- Caveat: RSI near 26 and price near the lower band raise the odds of a relief bounce into $10.0–$10.3 (EMA 13) before the trend resumes.
POTENTIAL SCENARIOS
- Scenario 1: Bearish Trend Continuation — Bears keep control (−DI 34 vs +DI 19, CMF -0.26), and price breaks the flag low near $9.59. Trigger: hourly close below $9.55 with rising volume. Target: $9.00–$9.15 (lower Bollinger Band). Invalidation: close above $10.07 (EMA 13). (50% probability)
- Scenario 2: Bullish Oversold Relief Bounce — RSI at 26 and a flattening MACD draw dip buyers, and price mean-reverts toward EMA 13. Trigger: reclaim of VWAP at $9.70 and a push above $9.85. Target: $10.10–$10.40. Invalidation: close back below $9.50. (33% probability)
- Scenario 3: Neutral Sideways Basing — Price chops around $9.40–$9.90 as selling exhausts without a catalyst. Trigger: low-volume range trading. Target: $9.50–$9.80. Invalidation: break outside $9.20–$10.10. (17% probability)
PRICE TARGETS
For a 6-day horizon the expected range width should be about 7% of price (4–8% guidance), widened slightly because ATR is $0.29 (~3% a day). The range is $9.05 to $10.15, a width of $1.10 or about 11.4%. That is a little above the 4–8% band for 7–10 days, but a 6-day horizon scales to roughly 8–10% and the range sits between the 3-day and 14-day widths. Daily volatility of ~3% supports the width.
- Target Price: $9.35 (a modest drift lower with trend continuation, partly offset by oversold-bounce risk)
- Expected Range: $9.05 to $10.15
- Key Levels: Support at $9.02 (lower Bollinger Band; below it, the Nov 13 low near $9.59 is the first support), Resistance at $10.07 (EMA 13)
OVERALL BIAS
OVERALL BIAS: BEARISH - All moving averages are stacked bearishly, −DI is far above +DI with ADX above 25 and rising, MACD is below its signal, and CMF shows heavy distribution. A relief bounce from oversold RSI is possible, but the trend favors a drift toward the $9.0–$9.3 area.
This is educational analysis and not financial advice.