RGTI 4-day bearish forecast — Nov 15, 2026
- Bias: Bearish
- Timeframe: 4 days (made Nov 15, 2026, target date Nov 18, 2026)
- Price at analysis: $9.62
- Price target: $9.45
- Expected range: $9.15 – $9.75
- Result: Pending — graded after the close on Nov 18, 2026
Get a free AI analysis of RGTI today
Analysis
TECHNICAL INDICATORS
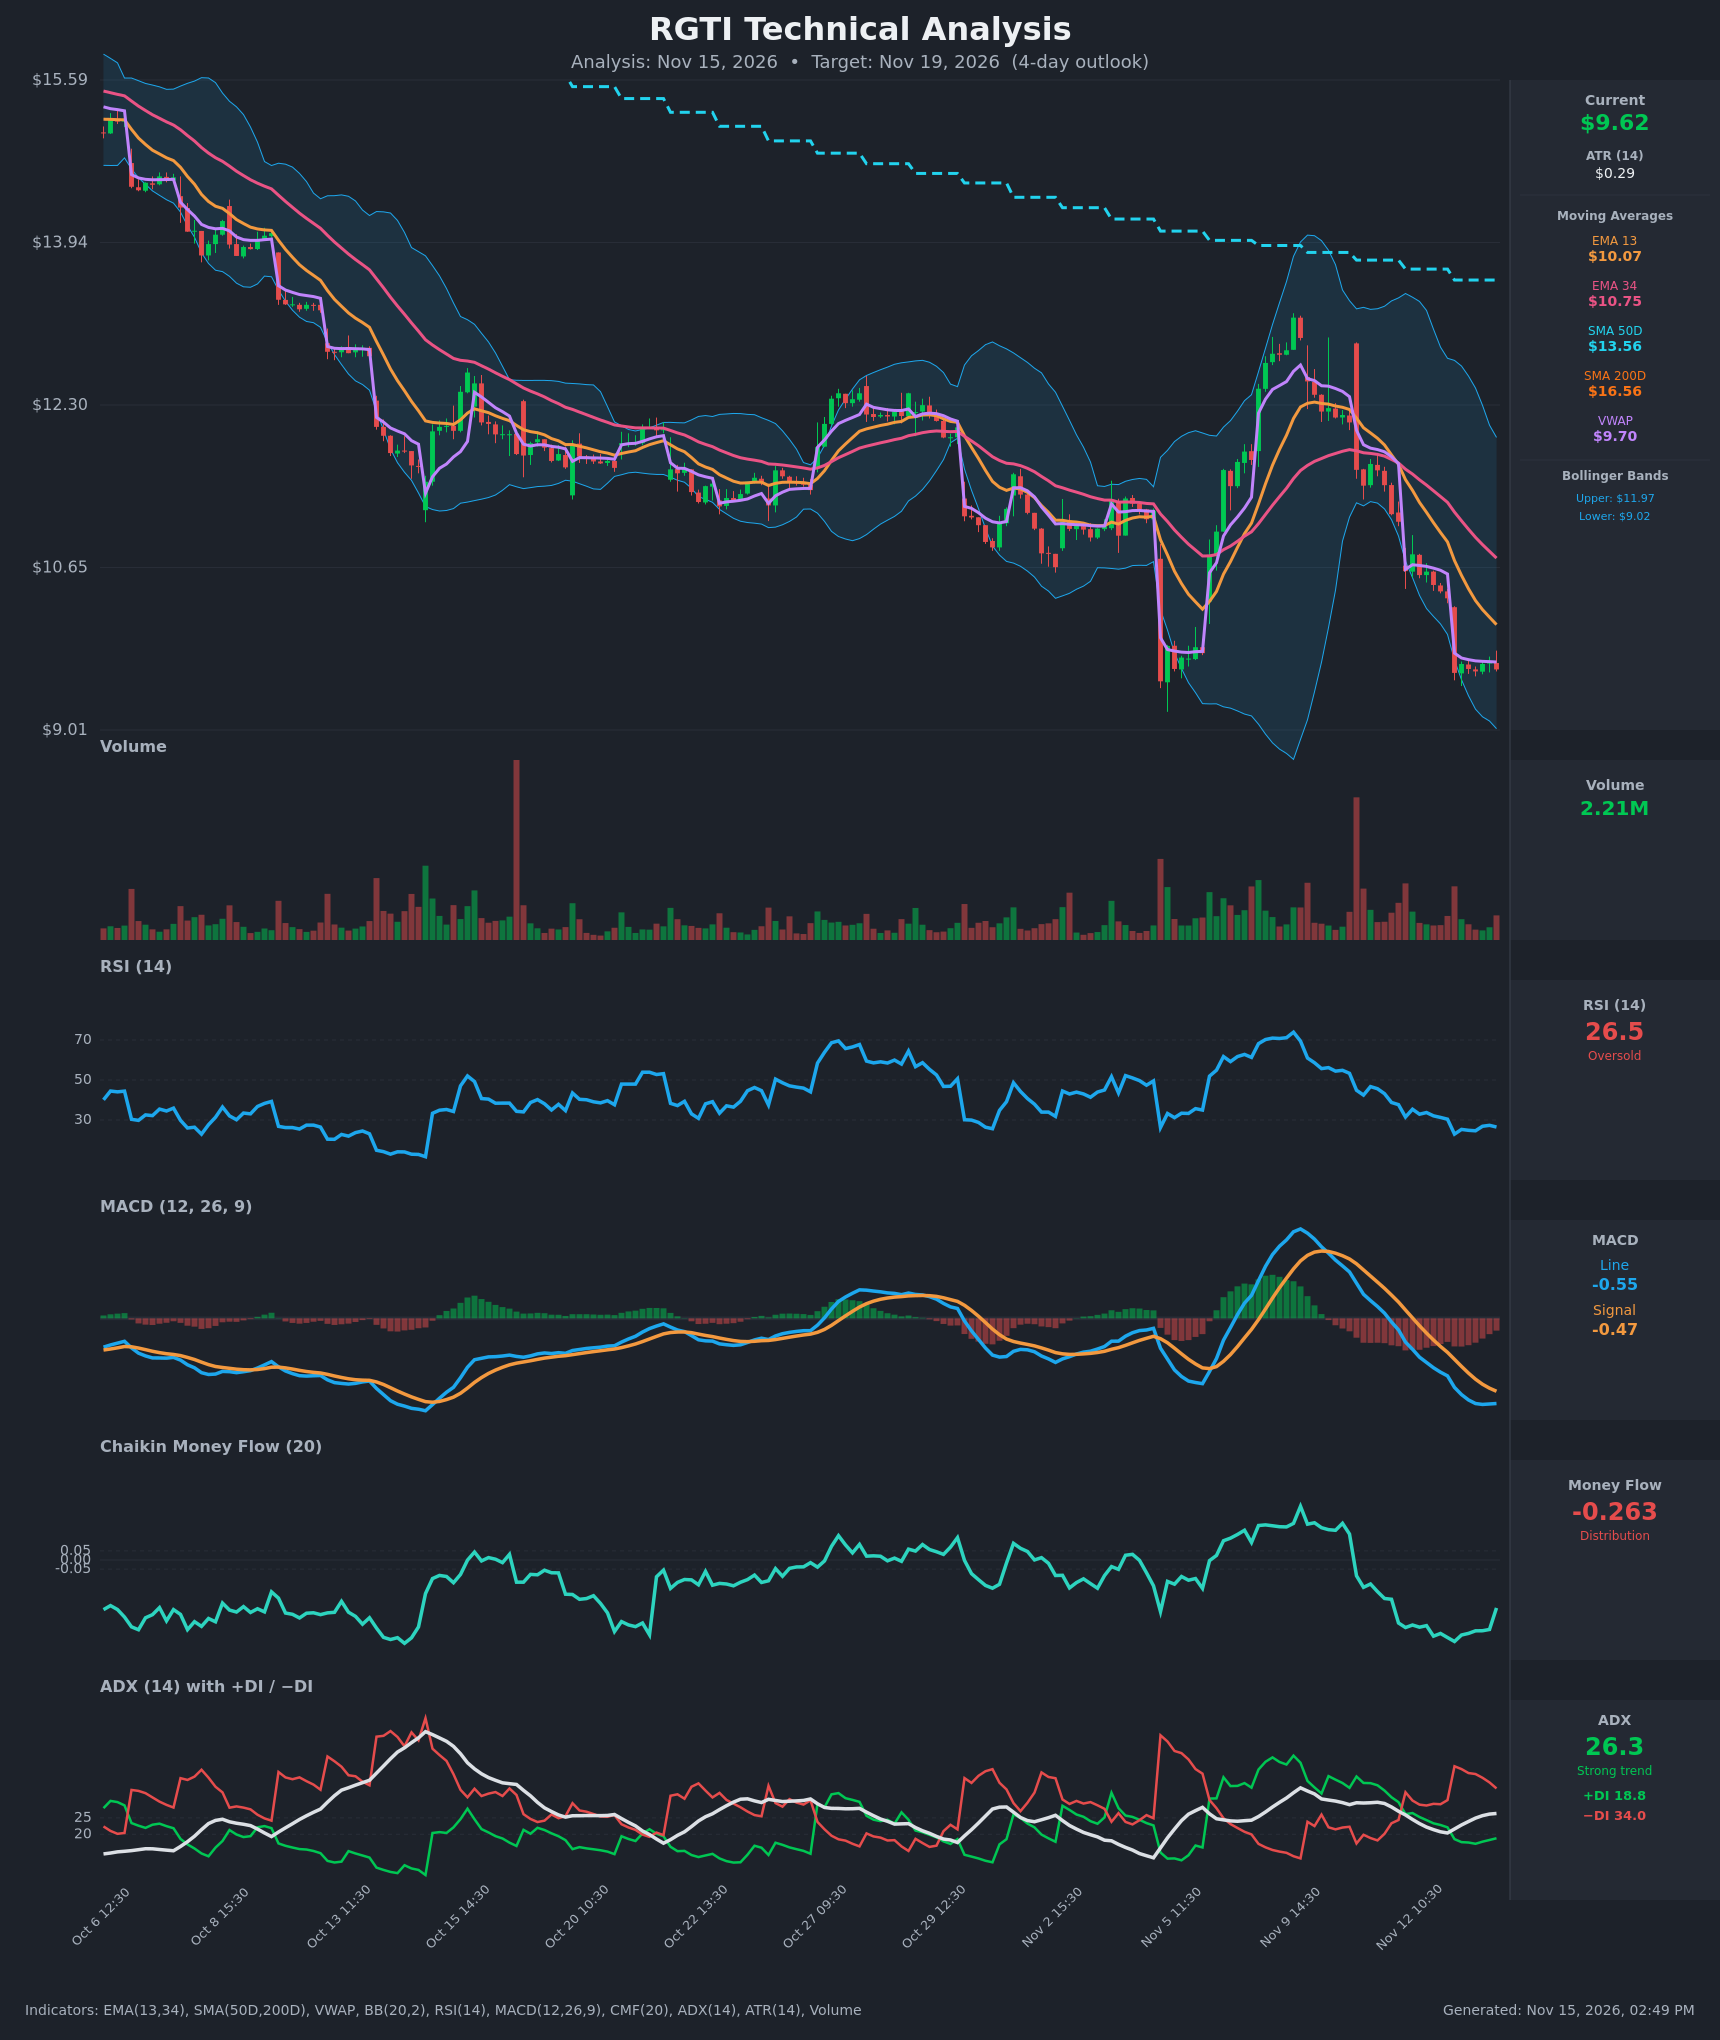
- RSI (14): 26.48, oversold, after a low of 22.9 on Nov 13 open. It has ticked up from that low but has stayed under 30 for most of the last 8 bars. Oversold readings in a strong downtrend can persist, so this is a bounce setup rather than a reversal signal. [Neutral]
- 20 EMA (EMA 13 / EMA 34 used): EMA13 is $10.07 and EMA34 is $10.75. Price at $9.62 is below both, and EMA13 is below EMA34 (bearish cross in place since early Nov). Both are falling and act as overhead resistance. Price is also well below SMA50D ($13.56) and SMA200D ($16.56), and the 50D is below the 200D (death-cross structure). [Bearish]
- MACD: Line -0.550 is below signal -0.471, a bearish cross that has held since Nov 12. The histogram is about -0.079, narrower than -0.18 at the Nov 13 open. Momentum is still negative but its decline is slowing, with the line flattening near -0.55. [Bearish]
- Bollinger Bands (20): Upper $11.97, lower $9.02. Price at $9.62 sits in the lower quarter of the band, after a walk along the lower band and a sharp drop on Nov 13. The bands are wide, so volatility is elevated. There is room to the lower band, and a mean-reversion bounce toward the middle band (~$10.5) is possible. [Neutral]
- CMF (20): -0.263, clear distribution (below -0.05). It has improved from -0.447 but remains deeply negative, so sellers still dominate. [Distribution]
- ADX (14): 26.3 and rising, above the 25 trend threshold. −DI at 34.0 is well above +DI at 18.8, with the gap widening from Nov 12. This is a strong downtrend with bears in control. [Strong Trend – Bearish]
- Volume: 2.21M, moderate and near the recent average, with no capitulation spike on the latest drop. Volume was heavier on down bars during the Nov 12–13 selloff. Without a washout volume spike, a durable bottom is less likely. [Mildly Bearish / No capitulation]
DIVERGENCES & TRENDS
- No bullish RSI divergence yet. Price made lower lows into Nov 13, and RSI (~26) is not clearly above its previous low (22.9). RSI is simply making a shallow higher low on the last few bars.
- MACD histogram: it is narrowing from -0.18 to -0.08. This is early momentum deceleration, not yet a bullish cross.
- CMF: it has risen from -0.447 to -0.263 while price stayed flat around $9.60–9.69. This is a mild positive divergence, but the reading is still distribution.
- VWAP: price is at $9.62 against VWAP $9.70, a slight rejection below it.
- Trend structure: Nov 9 produced a lower high near $13.2 below the falling SMA50D. Since then price has made lower lows. −DI dominance and a falling EMA stack confirm the trend.
- Breaks: price broke below the Nov 5 swing zone near $9.2–9.4 area region on a wick only. It remains above the $9.02 lower band.
CHART PATTERNS
- Bearish Flag / Bearish Pennant (continuation): after the sharp drop on Nov 13, price has consolidated in a tight $9.59–9.69 range. This fits the bearish flag/pennant template. A break below ~$9.58 would project the flagpole (~$10.34 → $9.59, about $0.75) to roughly $8.85, beyond the 4-day horizon, so I treat only a partial move as the base case.
- Broader structure: a descending series of lower highs and lower lows, with price under falling EMAs. This is a descending channel, consistent with continuation.
- Counter-pattern: if the consolidation resolves upward with expanding volume, a Bullish Falling Wedge/Double Bottom (near $9.2) could develop. The $9.2 zone is a possible double-bottom base, but it is unconfirmed.
POTENTIAL SCENARIOS
- Scenario 1: Bearish Flag Breakdown / Trend Continuation — price breaks the tight $9.59–9.69 consolidation and the strong −DI trend extends, pressing the Nov 5 low zone. Trigger: hourly close below $9.55 with volume above ~2.5M. Target: $9.20–9.30, with an extension toward the lower Bollinger Band at $9.02. Invalidation: hourly close above $10.07 (EMA13). (50% probability)
- Scenario 2: Bullish Oversold Bounce — RSI below 27, narrowing MACD histogram and improving CMF fuel a relief rally toward VWAP and EMA13. Trigger: reclaim of VWAP ($9.70) and a close above $9.85. Target: $10.07–$10.30. Invalidation: close below $9.40. (38% probability)
- Scenario 3: Neutral Chop — price continues the tight consolidation around $9.45–$9.85 as selling exhausts but buyers stay absent. Trigger: no break of $9.40 or $9.90. Target: ~$9.60. Invalidation: any decisive break outside that range. (12% probability)
PRICE TARGETS
For a 4-day horizon, the range width is about 6% of the current price.
- Target Price: $9.45
- Expected Range: $9.15 to $9.75 (width $0.60 ≈ 6.2% of $9.62)
- Key Levels: Support at $9.20, Resistance at $9.70
OVERALL BIAS
OVERALL BIAS: BEARISH - A strong downtrend (ADX 26.3, −DI 34.0 vs +DI 18.8), price below all moving averages with EMA13 below EMA34, a negative MACD cross, and CMF in distribution (-0.263) outweigh the oversold RSI. The bounce risk is real, but there has been no volume capitulation or confirmed reversal, so I lean toward modest downside continuation.
This is educational analysis and not financial advice.