RGTI 13-day bearish forecast — Nov 15, 2026
- Bias: Bearish
- Timeframe: 13 days (made Nov 15, 2026, target date Nov 27, 2026)
- Price at analysis: $9.62
- Price target: $9.30
- Expected range: $8.75 – $9.90
- Result: Pending — graded after the close on Nov 27, 2026
Get a free AI analysis of RGTI today
Analysis
TECHNICAL INDICATORS
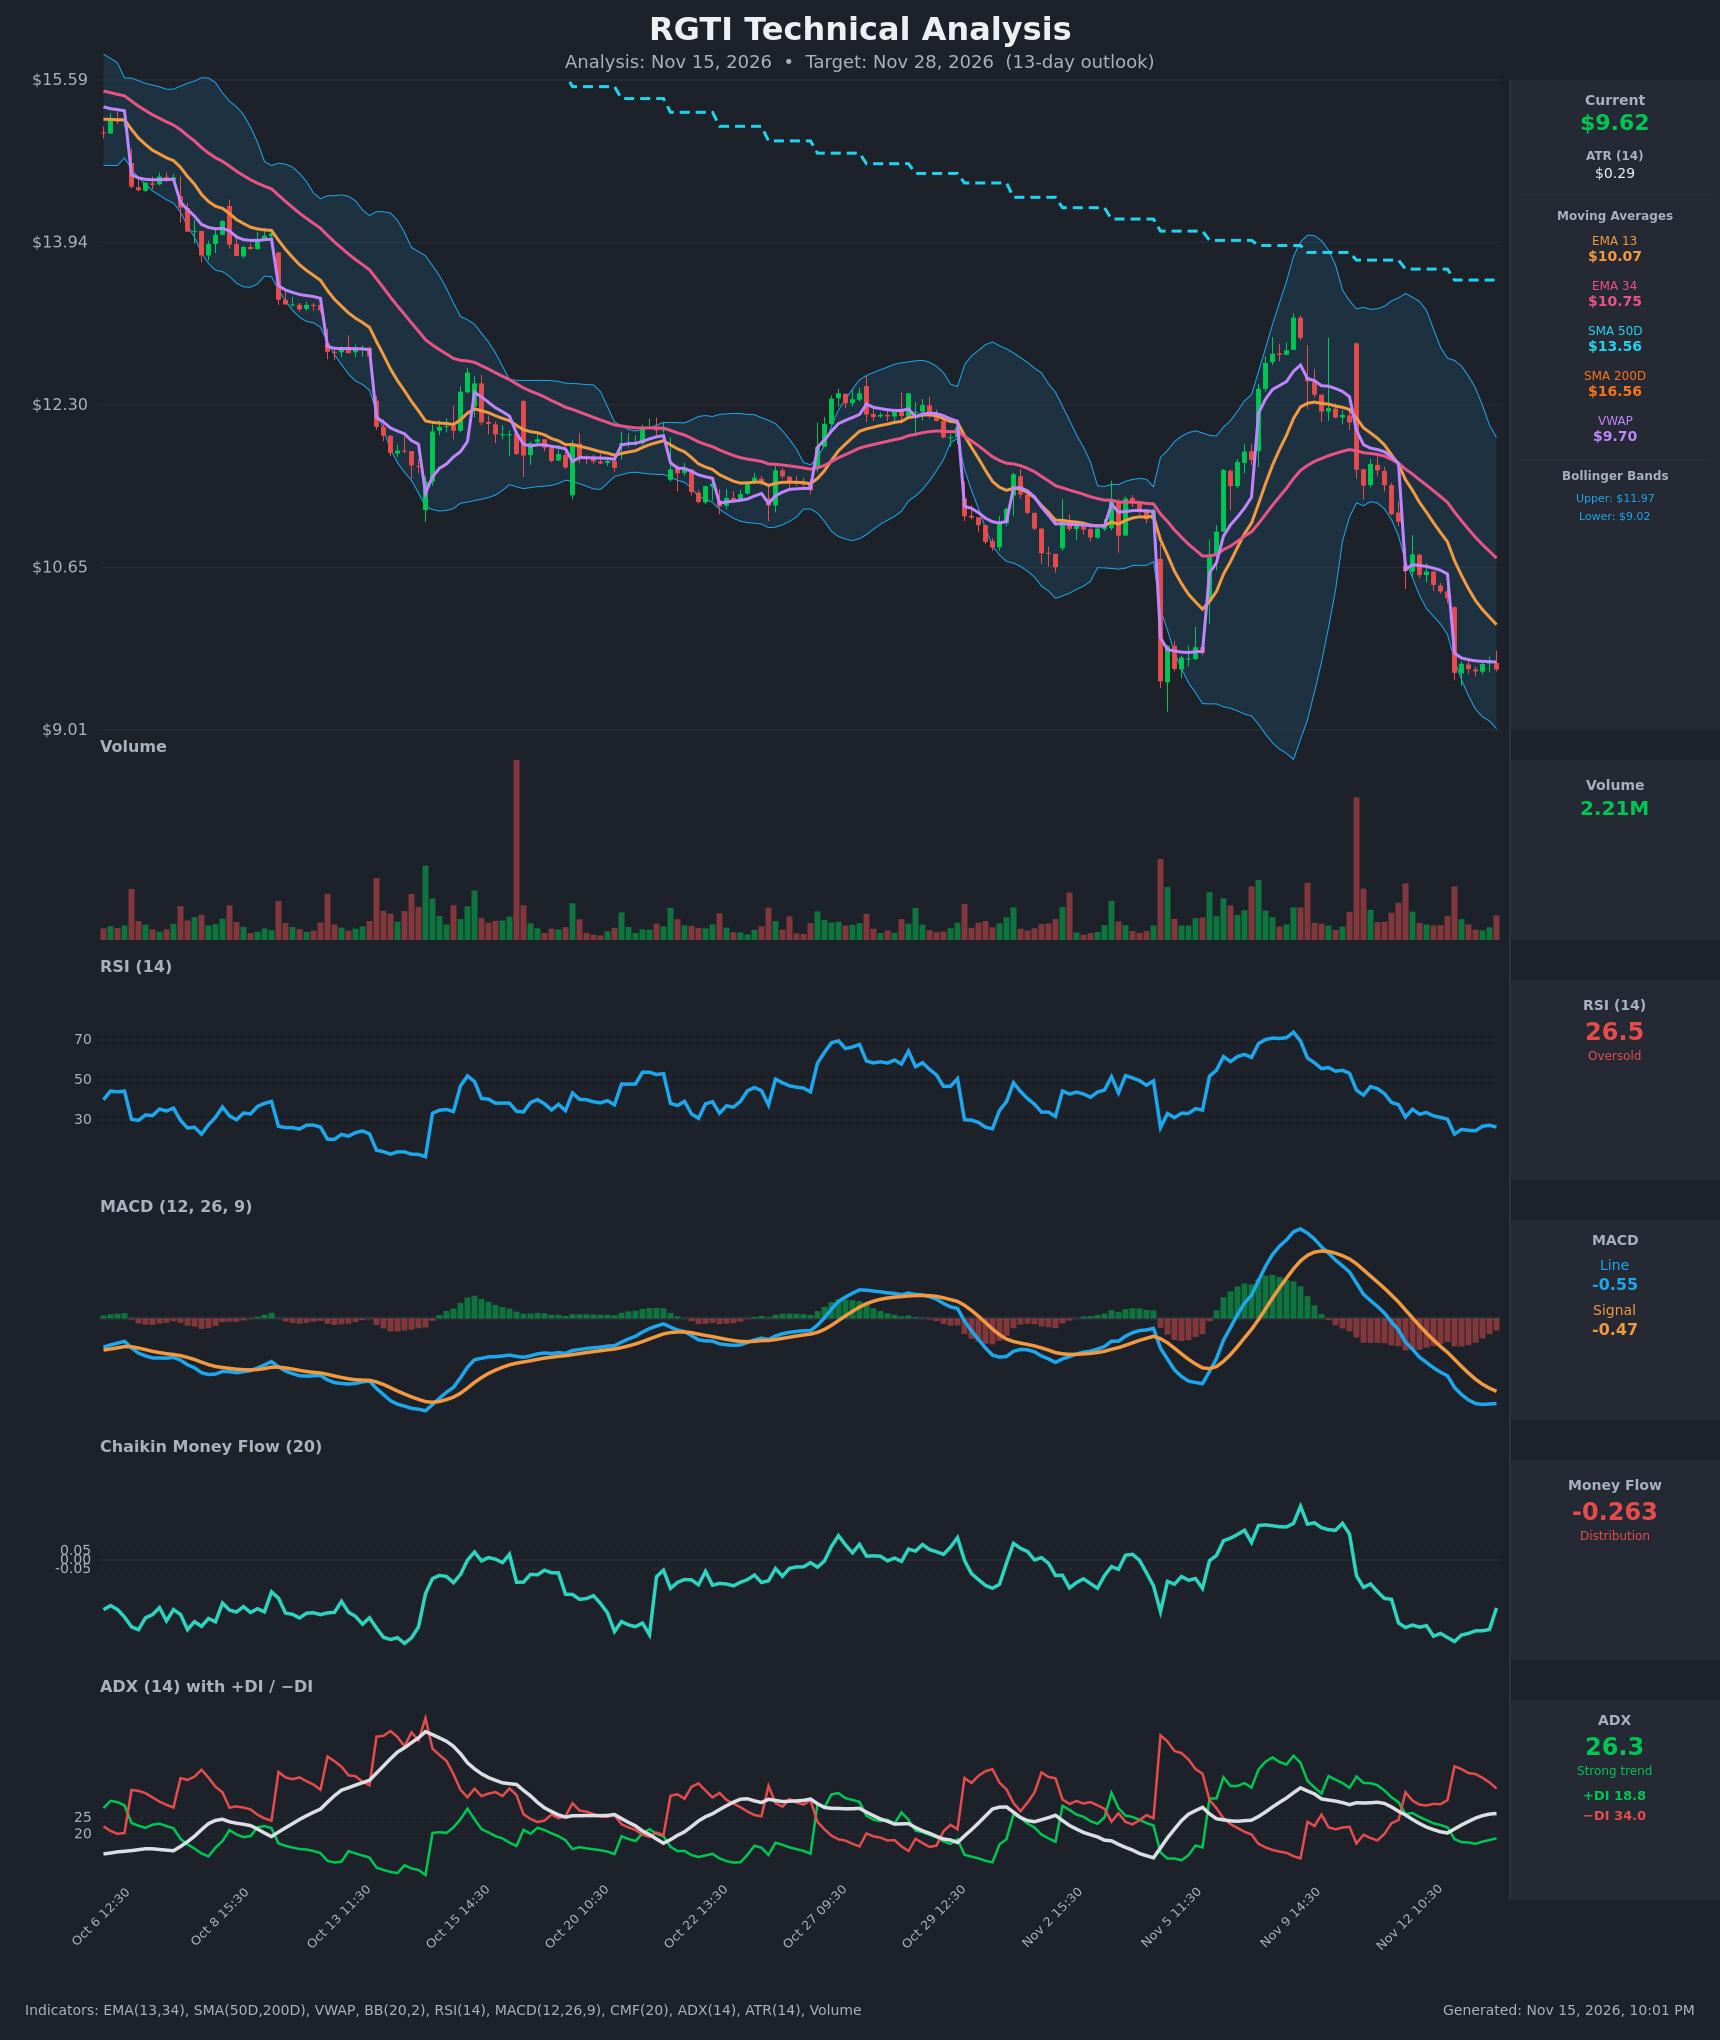
- RSI (14): 26.48, in oversold territory. It fell from 37.7 on Nov 11 to a low of 22.9 on Nov 13 and has only bounced to the mid-20s. There is no bullish turn yet, and RSI can stay oversold in strong downtrends. [Bearish]
- 20 EMA: The chart gives EMA 13 at $10.07 and EMA 34 at $10.75. Price at $9.62 is below both, and EMA 13 is below EMA 34 and falling (a bearish cross that is already in place). Both averages act as overhead resistance. [Bearish]
- MACD: The line (-0.550) is below the signal (-0.471) after a bearish crossover on Nov 12. The histogram is negative. The line has flattened near -0.55 while the signal catches down, so downside momentum is easing but not reversed. [Bearish]
- Bollinger Bands (20): The bands run from $9.02 to $11.97, and price at $9.62 sits in the lower quarter of the range. The bands are wide after the Nov 9–13 sell-off. Price is hugging the lower band without a close back inside the mid-range, which signals a trend that is stretched but still intact. [Bearish]
- CMF (20): -0.263, well below -0.05, so distribution is heavy. It ticked up from -0.38 to -0.26 on the last bar, but it is still deeply negative. [Distribution]
- ADX (14): 26.3 and rising from 20.4 on Nov 12. −DI (34.0) is far above +DI (18.8), so bears are in clear control. [Strong Trend – Bearish]
- Volume: 2.21M, modest and below the sell-off spikes seen around Nov 5 and Nov 10. The decline is not climaxing on a capitulation volume spike, which argues against a confirmed washout bottom. [Neutral to mildly bearish]
DIVERGENCES & TRENDS
- There is no bullish RSI or MACD divergence. RSI made a lower low (22.9 on Nov 13) with price, and MACD is making new lows, so momentum confirms price.
- RSI is oversold and CMF has just begun to tick up. Together they hint at a possible short-term relief bounce, but nothing is confirmed.
- Moving averages are in full bearish alignment: price ($9.62) < VWAP ($9.70) < EMA 13 ($10.07) < EMA 34 ($10.75) < SMA50 ($13.56) < SMA200 ($16.56).
- The death cross (SMA50 below SMA200) is already established, and the SMA50 is still falling.
- Price is below the SMA200 by about 42%, a long-term downtrend with a very extended gap to the mean.
- The ADX has turned up above 25 with −DI dominant, which confirms the downtrend is strengthening.
- Price is below VWAP, so intraday sellers hold the edge.
- The Nov 5 low (~$9.2–9.3) is the key nearby reference. Price is now about 4% above it after rejection from the $13 area.
CHART PATTERNS
- Bearish trend structure (lower highs and lower lows): the recent rally to ~$13 failed well below the prior $15 level and has since fully reversed. This resembles a bearish continuation, a failed bounce inside a long descending channel. It has no clean flag or pennant, so measured targets are imprecise.
- Potential Bullish Double Bottom (tentative): the Nov 5 low near $9.2–9.3 and the current test of the $9.0–9.6 zone could form a double bottom. It needs a hold above ~$9.2 and a break above the ~$10.1 EMA 13 cluster to confirm. Neither has happened yet, so this is a lower-probability scenario.
- A break below $9.02 (the lower Bollinger Band and the area of the Nov 5 low) would open the way to a measured extension of roughly $8.5–8.7.
POTENTIAL SCENARIOS
- Scenario 1: Bearish Trend Continuation — The −DI-led downtrend persists, with MACD below its signal and distribution (CMF -0.26) continuing. Rallies fade at VWAP ($9.70) and EMA 13 (~$10.07). Trigger: a break and close below $9.30–9.02. Target: $8.75–9.30. Invalidation: a daily close above $10.10 (EMA 13) with RSI back above 40. (50% probability)
- Scenario 2: Bullish Oversold Relief Bounce — RSI is at 26 and price is near the lower Bollinger Band and the prior Nov 5 low. A bounce toward the EMAs is plausible, possibly forming a double bottom. Trigger: a reclaim of VWAP/$9.70 and a push above $10.07 with CMF rising toward 0. Target: $10.10–10.75 (EMA 13 to EMA 34). Invalidation: a close below $9.02. (35% probability)
- Scenario 3: Neutral Basing Range — Price consolidates between $9.0 and $10.0 as momentum resets without a breakout. Trigger: ADX rolling back under 25 and contracting volume. Target: $9.3–9.9. Invalidation: a close outside the $9.0–$10.1 band. (15% probability)
PRICE TARGETS
For a 13-day horizon, the range width should be about 8–12%. The Expected Range of $8.75 to $9.90 is $1.15 wide, or 12.0% of the current price, which fits the guidance.
- Target Price: $9.30 (13-day outlook, about 3.3% below the current $9.62)
- Expected Range: $8.75 to $9.90
- Key Levels: Support at $9.02 (lower Bollinger Band, near the Nov 5 low), Resistance at $10.07 (EMA 13, with VWAP at $9.70 as minor resistance)
OVERALL BIAS
OVERALL BIAS: BEARISH - Price is below every moving average with a death cross in place, MACD is below its signal, ADX is rising above 25 with −DI at 34 versus +DI at 18.8, and CMF shows heavy distribution. The oversold RSI (26.5) raises the odds of a relief bounce, but nothing confirms a reversal, so continuation toward ~$9.30 is favored.
This is educational analysis and not financial advice.