INTC 7-day bullish forecast — Oct 30, 2026
- Bias: Bullish
- Timeframe: 7 days (made Oct 30, 2026, target date Nov 6, 2026)
- Price at analysis: $66.09
- Price target: $68.00
- Expected range: $63.80 – $69.20
- Result: Incorrect (-20.9%) — closed at $52.25 on Nov 6, 2026; quality score 0/100
Get a free AI analysis of INTC today
Analysis
TECHNICAL INDICATORS
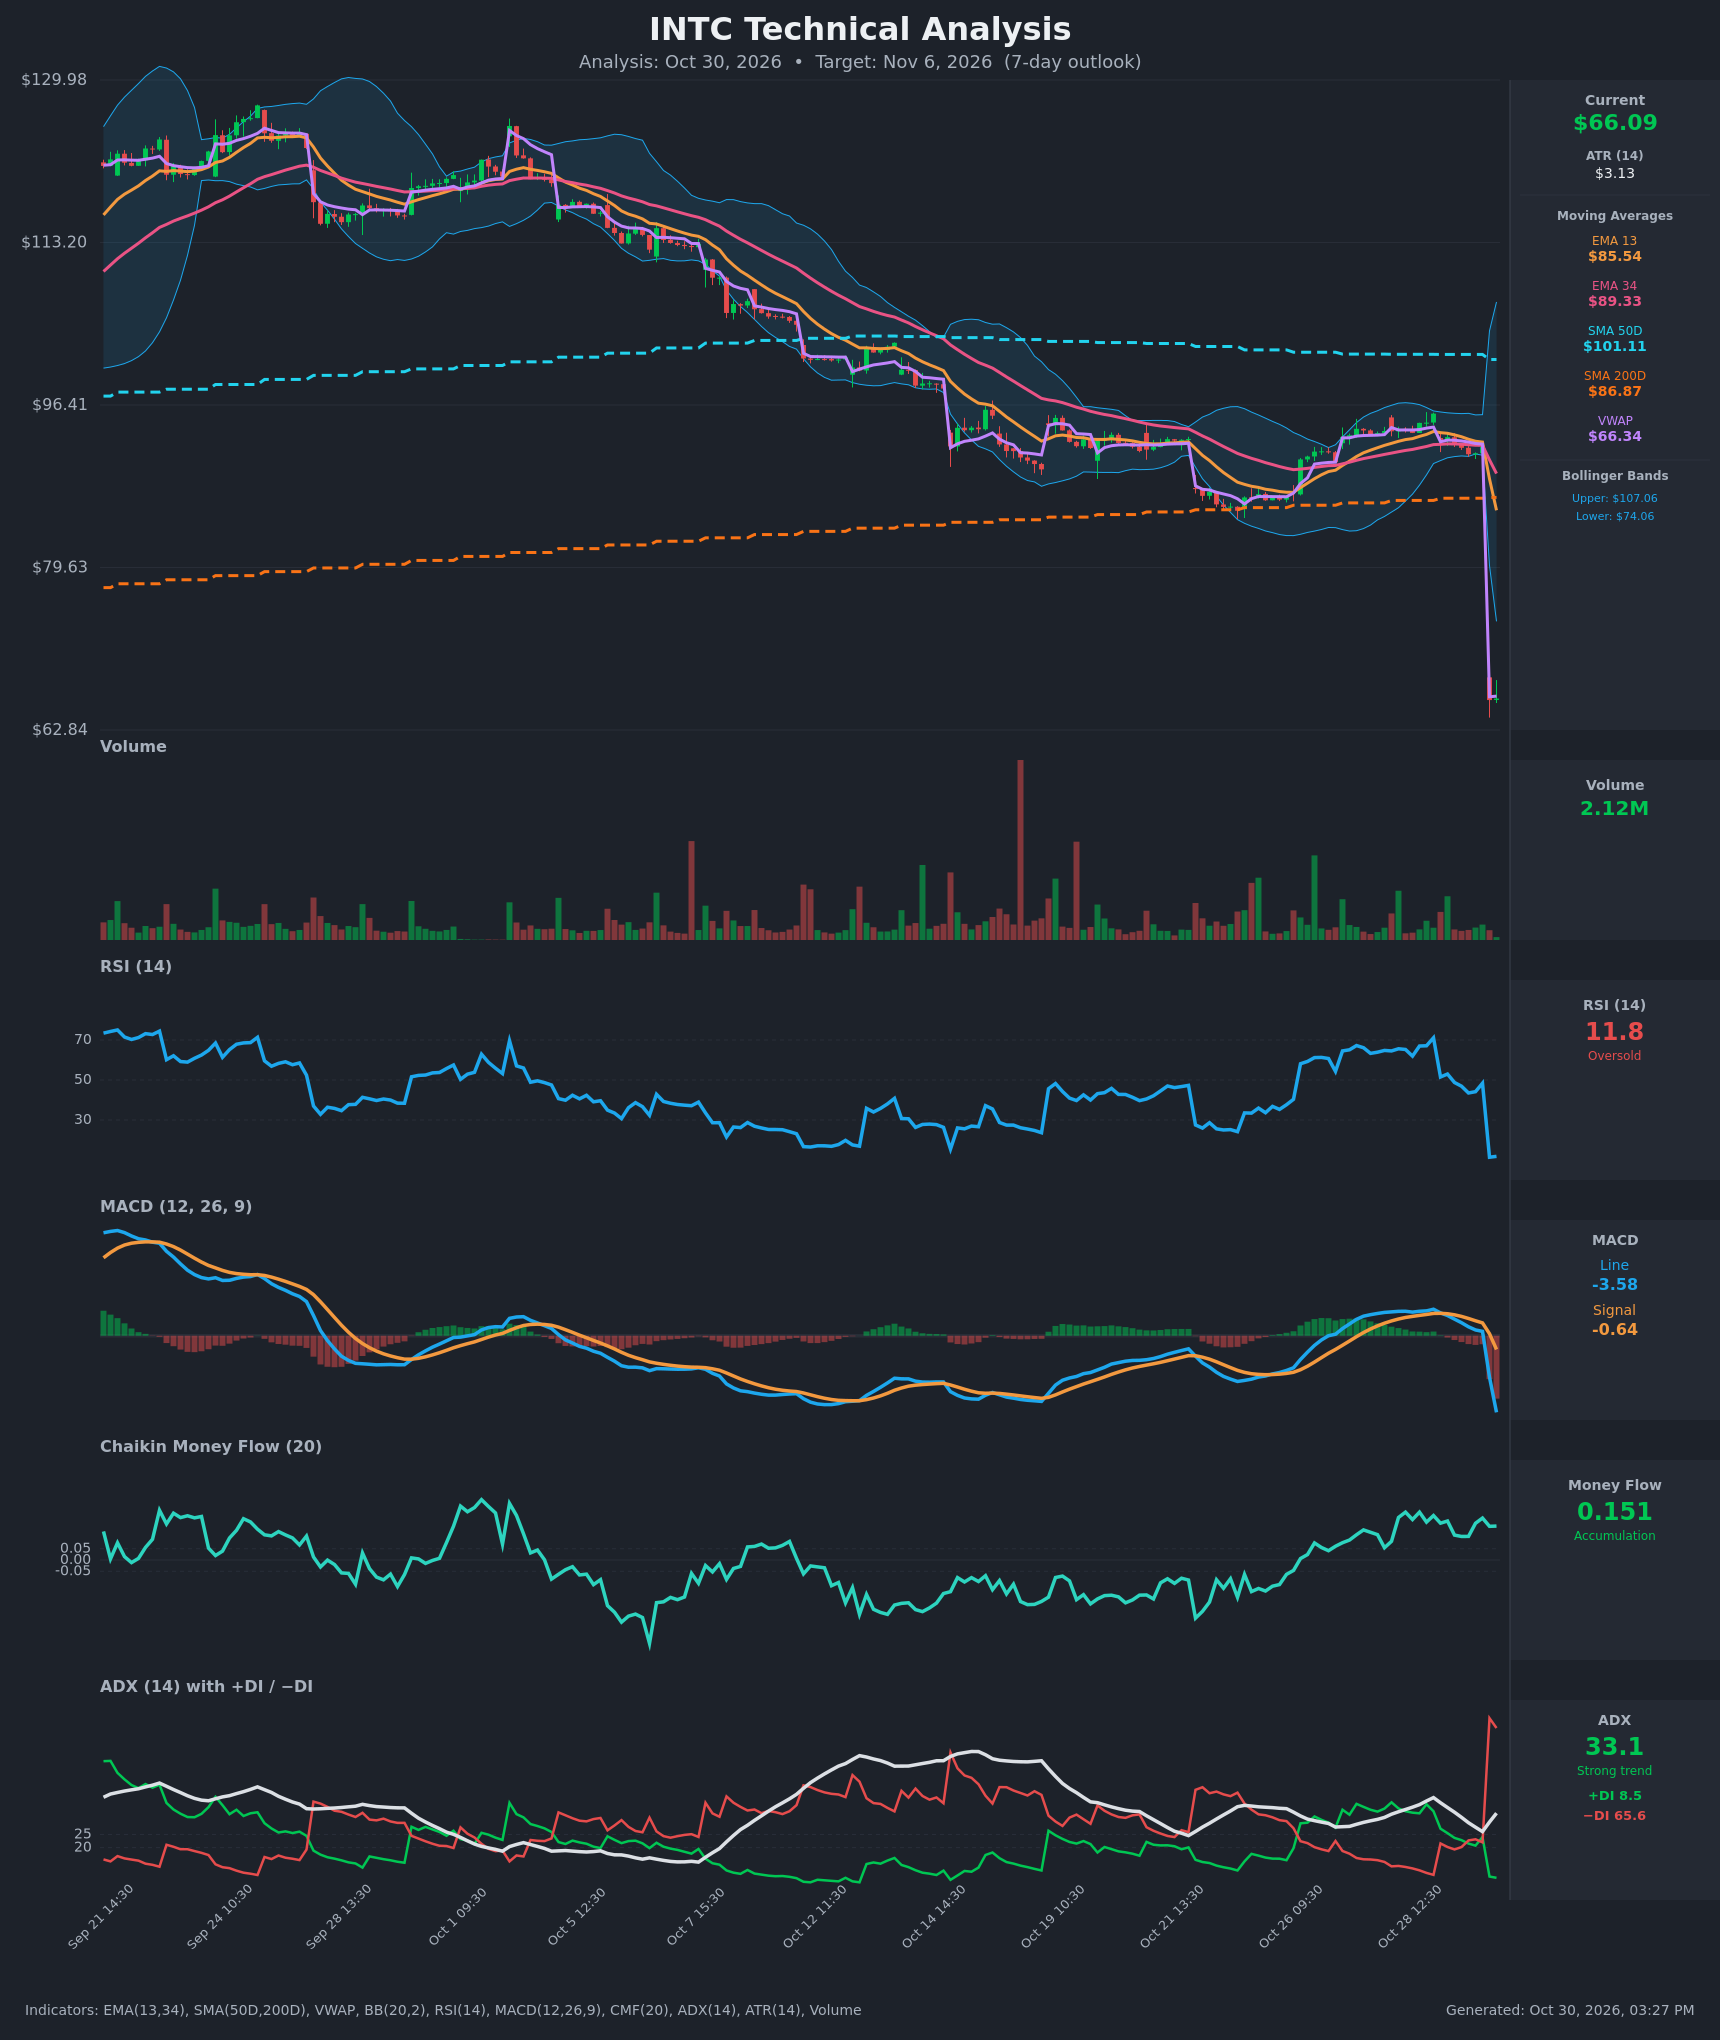
- RSI (14): 11.82, deeply oversold. It collapsed from 48.4 to 11.4 in a single bar, a capitulation-type reading. Momentum is violently negative, but readings this low often precede a relief bounce. [Neutral, with a bullish mean-reversion lean]
- 20 EMA (EMA 13 / EMA 34 shown): EMA 13 is $85.54 and EMA 34 is $89.33. Price at $66.09 is about 23% below EMA 13, so both act as heavy overhead resistance. EMA 13 crossed below EMA 34 on the Oct 30 gap bar (92.58 vs 92.25 before, 88.78 vs 90.74 after). [Bearish]
- MACD: Line -3.58 vs signal -0.64, a fresh bearish crossover with a sharply negative, expanding histogram of about -2.9. The line is accelerating down with no sign of turning. [Bearish]
- Bollinger Bands (20): Upper is $107.06 and lower is $74.06. Price is about $8 (11%) below the lower band, a statistical extreme that has blown the bands wide open. This is a stretched condition that favors a snap-back, but it also shows a volatility shock, not a gentle trend. [Bearish near term, stretched]
- CMF (20): +0.151, accumulation. It is a lagging reading built mostly from pre-gap bars and has stayed positive for several sessions. It has not yet reacted to the gap, so I give it limited weight. [Accumulation]
- ADX (14): 33.1, rising from 26 to 33 in two bars. −DI is at 65.6 and +DI at 8.5, a massive bearish spread. The trend is strong and sellers are in complete control. [Strong Trend – Bearish]
- Volume: 2.12M on the latest bar, light for a ~28% gap, so the move is gap-driven rather than a fully absorbed capitulation. Price is hugging VWAP ($66.34), slightly below it, so intraday buyers and sellers are roughly balanced at the new level. [Neutral / Stabilizing]
DIVERGENCES & TRENDS
- There is no classic divergence. RSI and price made new lows together.
- CMF (+0.151) diverges from price, but it is stale and not a reliable bullish divergence.
- The prior structure was a long downtrend of lower highs, with price falling from about $130 to $92. The Oct 30 gap broke below the Oct 21–29 consolidation and the SMA200 ($86.87) in one move.
- EMA 13 has crossed below EMA 34 (bearish). SMA50 ($101.11) is still above SMA200 ($86.87), so there is no death cross yet, but the 50D is rolling over.
- Price is below every moving average and below the lower Bollinger Band.
- MACD has crossed bearishly and is accelerating. The −DI spike confirms a trend-strength surge to the downside.
CHART PATTERNS
- Bearish breakdown / gap continuation: The sequence of lower highs and a failed bounce at EMA 34 and the SMA50 resembles a bearish pennant/flag (Oct 21–29) that resolved lower. The measured move from the gap has largely been achieved in one session.
- No reversal pattern is confirmed. Bullish reversals from the reference (double bottom, falling wedge) would need several sessions of basing, and none is present yet.
- Key gap zone: $92 down to $66. Partial retracement toward the lower Bollinger Band ($74) is the logical first target if a relief bounce develops. A full gap fill is unlikely within 7 days.
POTENTIAL SCENARIOS
- Scenario 1: Bullish Oversold Relief Bounce — RSI at 11.8 and price 11% below the lower band make a mean-reversion bounce likely as the post-gap shock is absorbed. VWAP at $66.34 is the pivot, and a base above ~$63 would support a drift higher. Trigger: hourly closes above VWAP ($66.34) and then $67.50. Target: $68–$70, with an extension to the lower Bollinger Band near $74. Invalidation: close below $63. (45% probability)
- Scenario 2: Bearish Post-Gap Continuation — ADX is rising with −DI dominant, and MACD is accelerating down. Post-earnings-type gap drift and forced selling push price to new lows. Trigger: break below the gap-day low of ~$62.84–$63. Target: $60–$62. Invalidation: reclaim of $68 on rising volume. (35% probability)
- Scenario 3: Neutral Post-Gap Consolidation — Price stabilizes and chops around VWAP as volatility compresses. Trigger: hourly closes between $64 and $68. Target: $65–$67. Invalidation: break outside $63–$69. (20% probability)
PRICE TARGETS
- Target Price: $68.00 (7-day)
- Expected Range: $63.80 to $69.20 (width $5.40, about 8.2% of current price, in line with the 7–10 day guidance, with elevated volatility acknowledged)
- Key Levels: Support at $62.84, Resistance at $74.06
OVERALL BIAS
OVERALL BIAS: BULLISH - Although trend indicators (MACD, ADX/−DI, EMAs) are decisively bearish, RSI at 11.8 and price roughly 11% below the lower Bollinger Band make a modest mean-reversion bounce the single most probable outcome. Expect a relief move toward $68, not a trend reversal. A close below $62.84 would flip the call to bearish.
This is educational analysis and not financial advice.