INTC 83-day bearish forecast — Nov 15, 2026
- Bias: Bearish
- Timeframe: 83 days (made Nov 15, 2026, target date Feb 5, 2027)
- Price at analysis: $59.66
- Price target: $54.50
- Expected range: $47.00 – $64.00
- Result: Pending — graded after the close on Feb 5, 2027
Get a free AI analysis of INTC today
Analysis
TECHNICAL INDICATORS
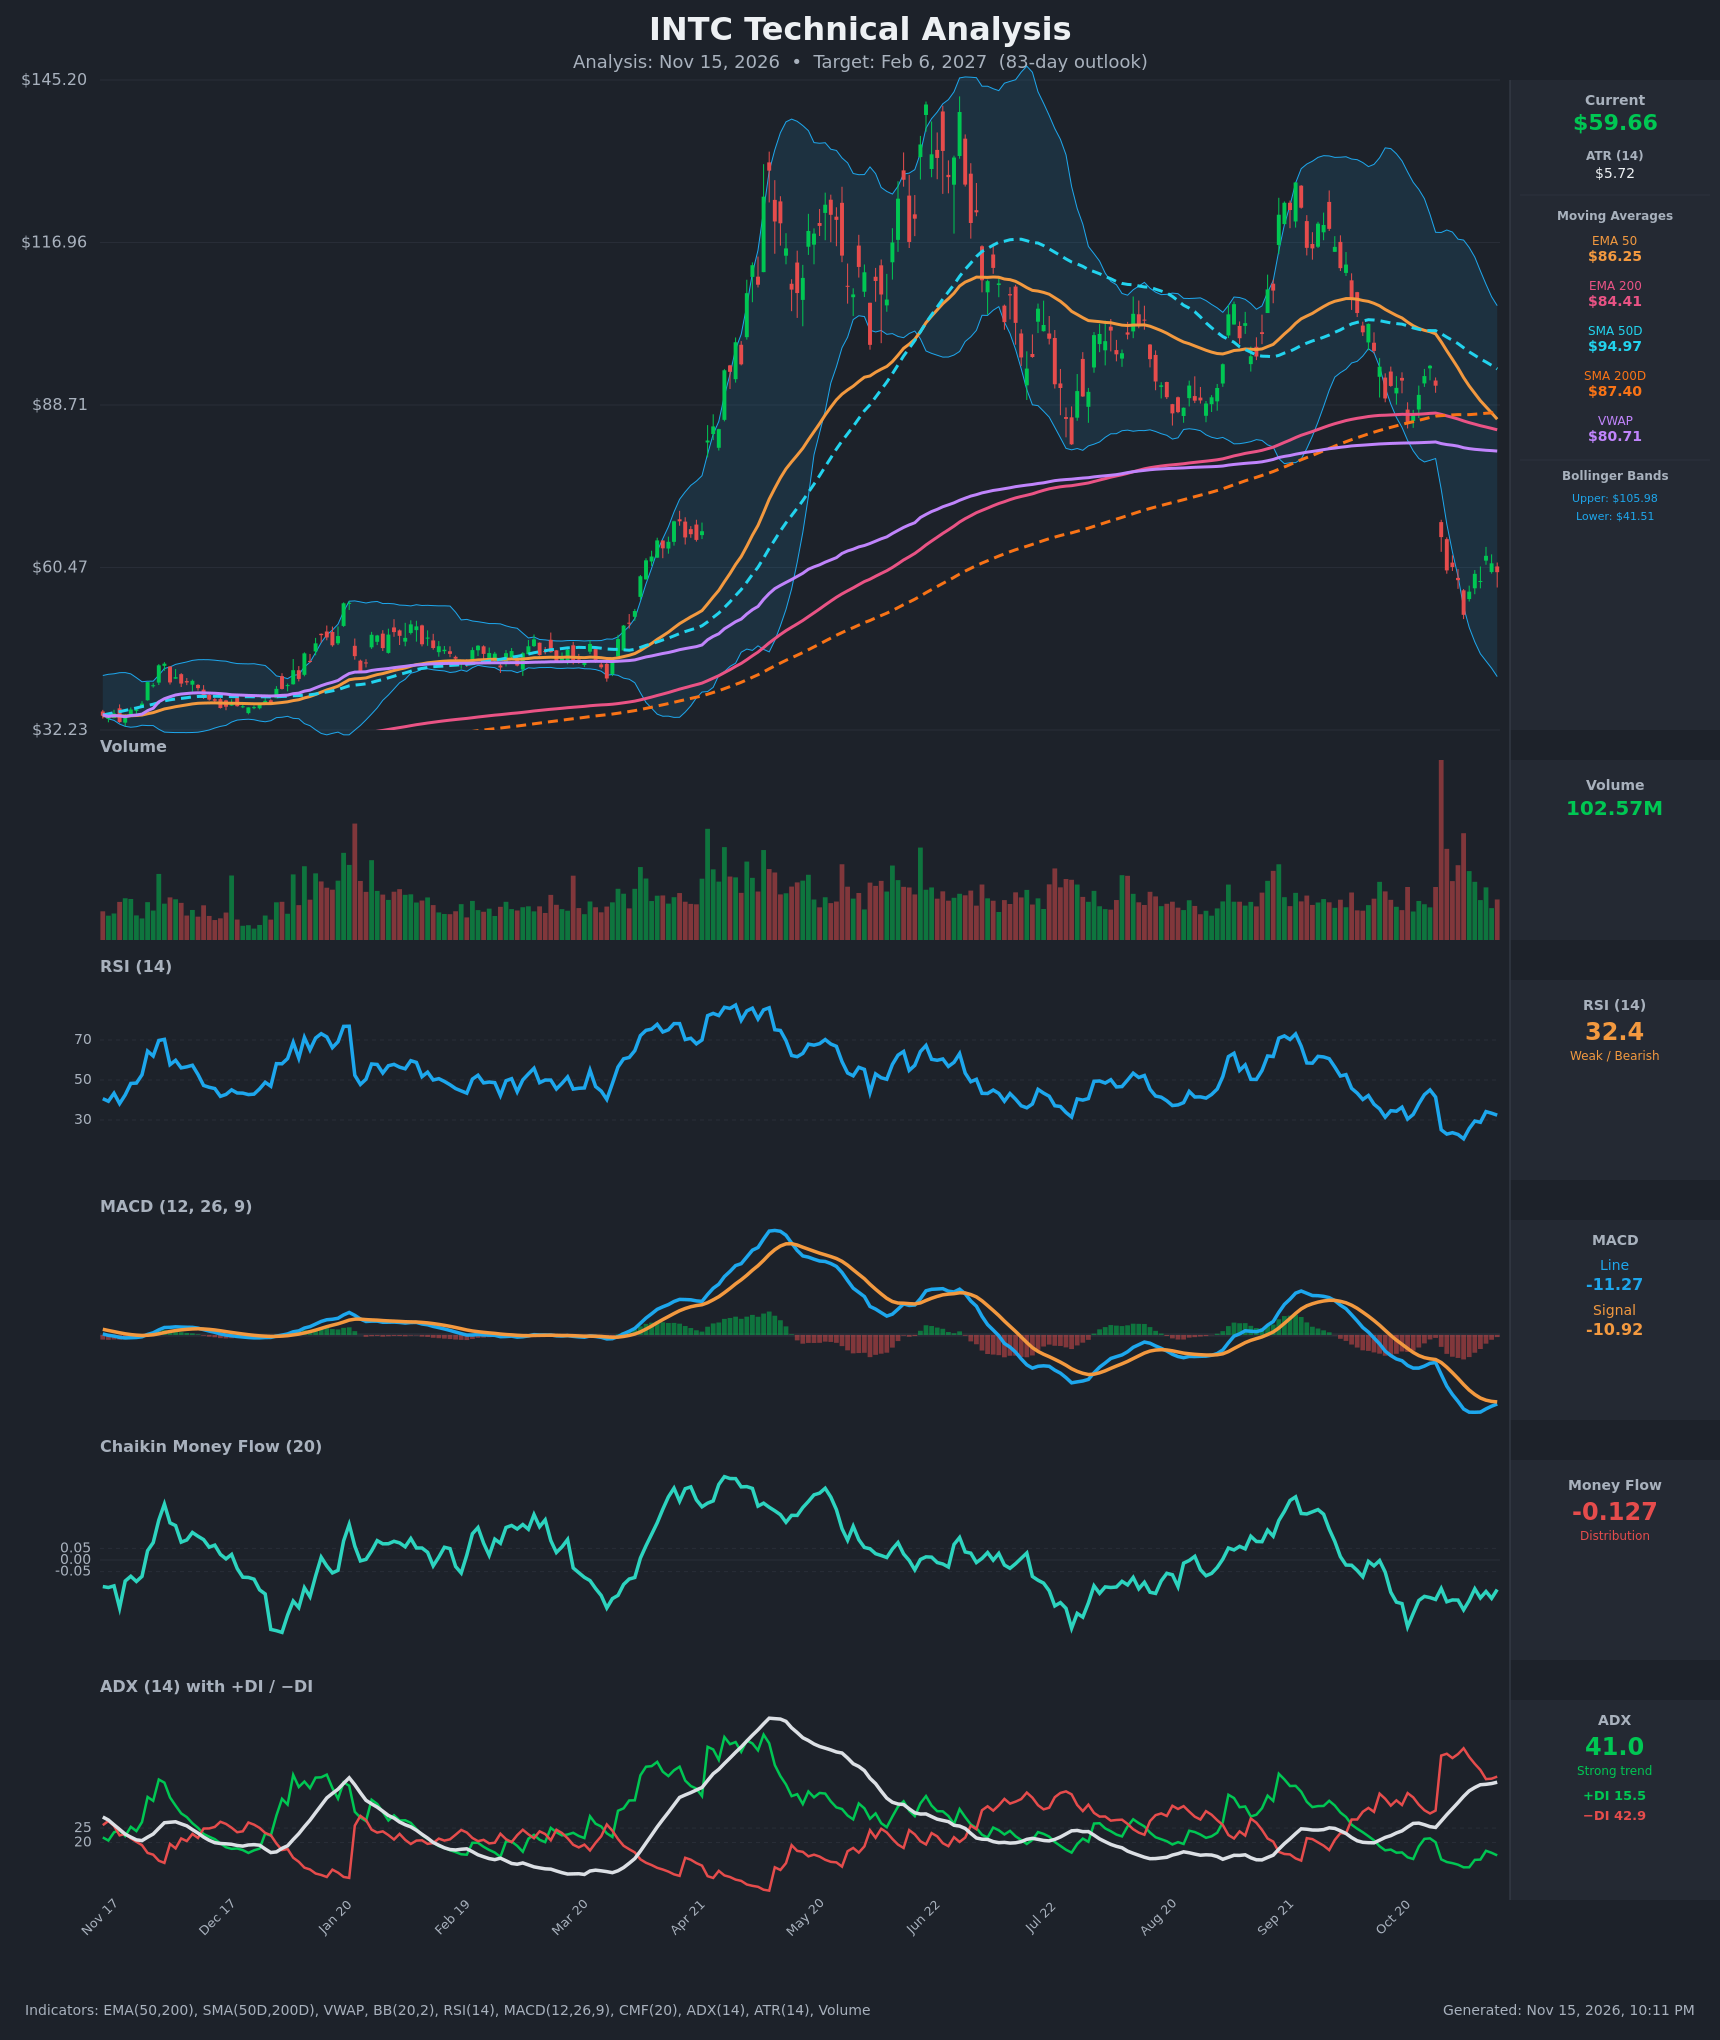
- RSI (14): 32.42, just above oversold. It hit 20.6 on Nov 5 and has bounced to the low 30s, but the recovery stalled below 35. Momentum is weak and has not turned up convincingly. [Bearish]
- 20 EMA: The 20 EMA isn't supplied, so I use the EMA 50 at $86.25 and EMA 200 at $84.41 as proxies. Price is about 31% below the EMA 50 and 29% below the EMA 200, and both sit overhead as heavy resistance. The EMA 50 is falling fast toward the EMA 200 (gap now only ~$1.84), so a bearish EMA cross is imminent. [Bearish]
- MACD: Line -11.27 is below signal -10.92, a histogram of about -0.34. The line peaked near -12.6 and is rising, so the histogram has narrowed from larger negatives. Momentum is deeply negative but bearish pressure is fading. It is still a bearish configuration with no bullish crossover yet. [Bearish]
- Bollinger Bands (20): Upper $105.98, lower $41.51, midline about $73.7. The bands are very wide after the gap-down volatility. Price at $59.66 is in the lower half, well below the midline, and has bounced off the lower-band area without reaching $41.51. The band midline is a distant ceiling. [Bearish]
- CMF (20): -0.127, below -0.05 and persistently negative for the whole post-gap period (range -0.12 to -0.22). Sellers are distributing into every bounce. [Distribution]
- ADX (14): 41.0 and rising steadily from 25. -DI at 42.9 is far above +DI at 15.5, with the spread near 27 points. This is a strong, mature downtrend, and bears are firmly in control. High ADX can precede exhaustion, but there's no DI crossover to signal that. [Strong Trend – Bearish]
- Volume: 102.57M, elevated compared with the pre-crash baseline. The huge red volume spike came on the Oct 30 gap-down (-28.6% in one day), and volume stayed heavy through the washout to $52.25. Recent bounce volume is lower than the selloff volume, which suggests the rebound is corrective rather than a true reversal. [Bearish – capitulation followed by weak bounce]
DIVERGENCES & TRENDS
- RSI: Price made a lower low on Nov 5 ($52.25) with RSI at 20.6. The retest areas at $58–59 show RSI at 28–32. There's no bullish divergence yet, only a reduction in downside momentum.
- MACD: The line is flattening and curling up toward the signal. A bullish cross is possible in coming sessions if price holds, but that would be a relief-rally signal inside a larger downtrend.
- Death cross: The SMA50D ($94.97) is still above the SMA200D ($87.40), but the gap has shrunk quickly from about $15.8 to $7.6. The EMA 50 is converging with the EMA 200, so both death crosses are likely within weeks.
- Price vs long-term averages: Price is well below the SMA200D, VWAP ($80.71) and all MAs. The structure is lower highs since the ~$130 peak, and the Oct 30 gap broke the August–October range and the SMA200D support.
- DI/ADX: The −DI surge and rising ADX confirm trend strength. +DI is at lows, so bulls are barely participating.
- CMF: It has been negative throughout the decline and has not improved on the bounce, so there is no accumulation signal.
CHART PATTERNS
- Bearish Flag Pattern (continuation): After the vertical gap-down from ~$92 to ~$60, price has consolidated in a $52–$62.50 range with a slightly rising structure of higher lows and lows. This resembles the Bearish Flag/Pennant in the diagram. A measured-move target from the flagpole (about $30 drop) is a long-range projection toward the low $30s, but I treat it as a tail risk rather than the base case, given the oversold RSI and the proximity of the lower Bollinger Band.
- Gap/breakdown structure: The lower-high sequence from the prior range ($105–$130 area) and the break below the SMA200D confirm a trend change. The gap zone ($65.76–$92) is overhead supply.
- Possible base (less likely): The $52–$62 range could form a Bullish Double Bottom (lows near $52 and $58), but that needs a close above $65.76 to confirm and isn't yet confirmed.
- Key significance: A close below $52.25 would complete the flag breakdown, with next support at the lower Bollinger Band (~$41.5).
POTENTIAL SCENARIOS
- Scenario 1: Bearish Flag Breakdown / Trend Continuation — Sellers keep control (ADX 41, −DI dominant, CMF negative), the bounce fails below the gap and the EMA/SMA death crosses add pressure. Trigger: daily close below $52.25 on rising volume. Target: $47 initially, then $41.50 (lower Bollinger Band). Invalidation: daily close above $65.76. (50% probability)
- Scenario 2: Neutral Base-Building Range — Price stabilizes after capitulation and chops between $52 and $65 as RSI works off oversold and MACD crosses up, without enough strength to break overhead supply. Trigger: holds $52.25 and fails at $62–$66. Target: $55–$62 range. Invalidation: close below $52 or above $66. (25% probability)
- Scenario 3: Bullish Relief Rally / Double Bottom — Oversold bounce with a MACD bullish cross and the MACD histogram turning positive. Short covering carries price into the gap zone. Trigger: close above $65.76 with volume expansion. Target: $72–$74 (Bollinger midline), with partial gap fill toward $80. Invalidation: loss of $58 after the breakout attempt. (25% probability)
PRICE TARGETS
- Target Price: $54.50 (83-day horizon)
- Expected Range: $47.00 to $64.00 (width $17.00 = ~28.5% of current price, consistent with the 61–180 day guidance)
- Key Levels: Support at $52.25, Resistance at $65.76
OVERALL BIAS
OVERALL BIAS: BEARISH - A strong downtrend (ADX 41 with −DI 42.9 vs +DI 15.5), price far below all key moving averages, persistent CMF distribution, a bear-flag-like consolidation after a gap-down, and an impending EMA/SMA death cross outweigh the oversold RSI and narrowing MACD histogram. Conviction is moderate because relief-rally risk is real.
This is educational analysis and not financial advice.