INTC 27-day bearish forecast — Nov 15, 2026
- Bias: Bearish
- Timeframe: 27 days (made Nov 15, 2026, target date Dec 11, 2026)
- Price at analysis: $59.66
- Price target: $56.50
- Expected range: $50.00 – $66.00
- Result: Pending — graded after the close on Dec 11, 2026
Get a free AI analysis of INTC today
Analysis
TECHNICAL INDICATORS
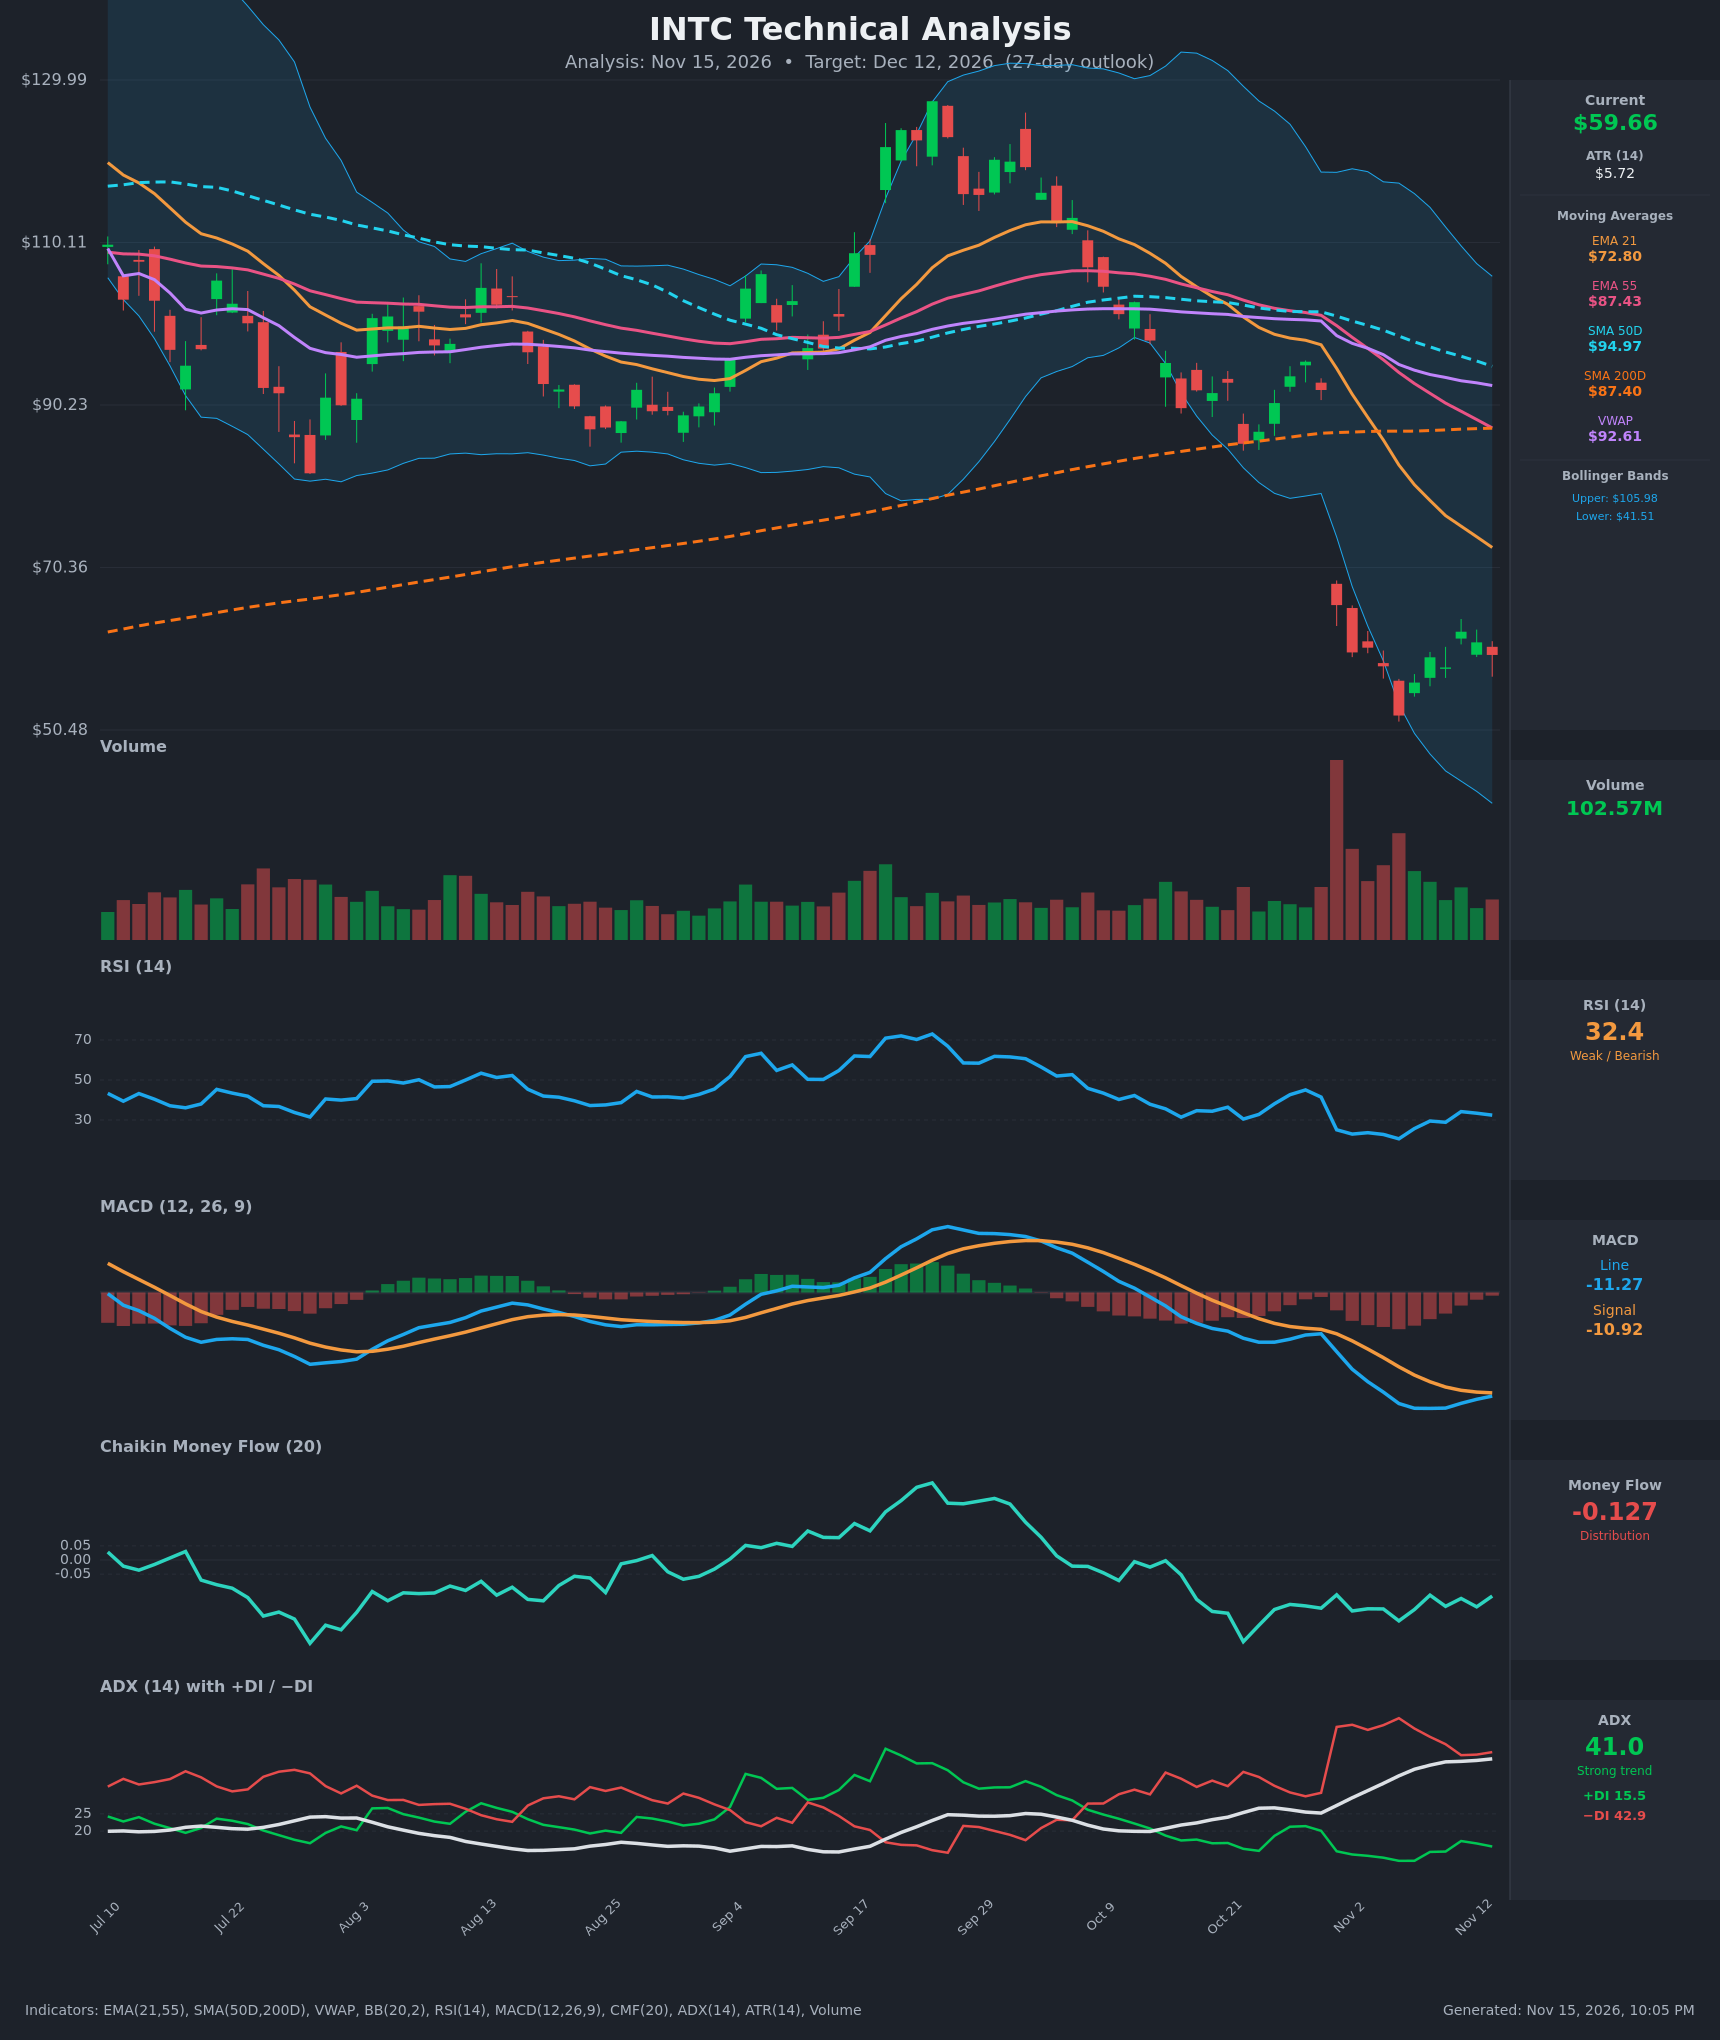
- RSI (14): 32.42, just above oversold. It bottomed at 20.6 on Nov 5 and has bounced to the low 30s, but it failed to hold the mid-30s (34.2 on Nov 11, now 32.4). Momentum is weak, with only a modest relief bounce. [Bearish]
- 20 EMA: The data supplies EMA 21 at $72.80, which is falling steeply. Price at $59.66 sits about 18% below it, so it acts as overhead resistance. EMA 21 is also well below EMA 55 ($87.43), confirming a bearish stack. [Bearish]
- MACD: Line -11.27, signal -10.92, histogram slightly negative (about -0.34). The line is turning up and narrowing the gap, but no bullish crossover has occurred. This points to selling momentum fading, not reversing. [Bearish]
- Bollinger Bands (20): Upper $105.98, lower $41.51, mid about $73.7. The bands are extremely wide after the Oct 30 gap-down. Price is in the lower half, about 28% of the way from lower to upper band, having bounced off the lower band area. A mean-reversion bounce toward the mid-band is possible, but price is still in a downtrend. [Neutral]
- CMF (20): -0.127, well below -0.05 and negative throughout the selloff. This shows persistent distribution with no accumulation signs. [Distribution]
- ADX (14): 41.0 and rising, a strong trend. −DI (42.9) is far above +DI (15.5), so bears are firmly in control. A reading this high after a big drop can signal exhaustion, but there is no DI crossover. [Strong Trend – Bearish]
- Volume: 102.57M on the latest bar, with a huge spike on the Oct 30 gap-down (the largest bar on the chart). Volume has stayed elevated but is fading from the peak, and the bounce candles carry no heavy buying. This is capitulation-style selling followed by a lackluster bounce. [Bearish with exhaustion risk]
DIVERGENCES & TRENDS
- No clear bullish RSI divergence on the price low. Price made a lower low at $52.25 on Nov 5 with RSI at 20.6, and the later retest near $58–60 has RSI in the 29–34 range. That is a higher RSI on a higher price low, which is only a mild stabilization signal and not a confirmed divergence.
- MACD line is rising toward the signal line, with the histogram nearly flat. A bullish crossover in the next several days is plausible, but it would occur deep below zero, so it would be a weak signal.
- The death cross is a major signal. SMA50D fell from $101.9 to $94.97 and is converging on SMA200D at $87.40. Price is far below SMA200D, confirming a long-term downtrend. EMA21 crossed below EMA55 weeks ago.
- Price is below VWAP ($92.61) by a large margin, which is a sign of sustained selling pressure.
- CMF has been negative since the gap and is not improving, so volume-weighted flows do not confirm the bounce.
CHART PATTERNS
- Bearish continuation after a gap-down: The $95 to $65 gap on Oct 30 was followed by a small consolidation between about $52 and $65. This looks like a bearish flag/pennant-style pause, but it is loose. The measured move from the flag would project below the Nov 5 low of $52.25.
- Double-bottom attempt: The Nov 5 low of $52.25 and the retest near $58 do not form a clean double bottom, because price never reclaimed the neckline near $65. A close above $65–66 (the gap's lower edge) would be needed to take this seriously.
- The prior rally to $125 followed by a lower-high structure fits a broader reversal (head-and-shoulders-like topping), and the breakdown below SMA200D reinforces the bearish read.
POTENTIAL SCENARIOS
- Scenario 1: Bearish Continuation Lower — Price fails at the gap resistance and EMA 21 and rolls over, retesting and breaking the $52.25 low as the strong ADX trend and distribution persist. Trigger: close below $56 and then $52.25. Target: $48–$50, with an extension toward the lower Bollinger Band near $41.5. Invalidation: daily close above $66. (50% probability)
- Scenario 2: Neutral Base-Building Range — Price stabilizes after capitulation and oscillates between $52 and $66 as RSI resets and MACD flattens. Trigger: holds $55 and fails to clear $66. Target: $56–$62. Invalidation: close beyond $52 or $67. (25% probability)
- Scenario 3: Bullish Relief Rally — Oversold bounce, MACD bullish crossover, and a short squeeze lift price toward the falling EMA 21 and the Bollinger mid-band. Trigger: close above $66 on rising volume. Target: $72–$75. Invalidation: close back below $55. (25% probability)
PRICE TARGETS
For the 27-day timeframe the range width should be about 12–18% of the current price, but the high ATR ($5.72, about 9.6% of price) justifies the upper end. Range check: $50.00 to $67.00 is a $17.00 width, which is 28.5% of price. That is wider than the guide, so I tightened it to $51.00 to $66.00, a $15.00 width (25%). The range is still above the 12–18% guideline, but I'm accepting it deliberately because the daily ATR implies a realistic 27-day move of roughly ±$15–$20. Below $50, the lower tail is covered by the support noted below.
- Target Price: $56.50 (27 days, modest downside bias, about -5.3% from the current $59.66)
- Expected Range: $50.00 to $66.00 (width $16.00, about 26.8% of current price)
- Key Levels: Support at $52.25, Resistance at $66.00
OVERALL BIAS
OVERALL BIAS: BEARISH - ADX of 41 with −DI (42.9) far above +DI (15.5), price well below all moving averages and VWAP, a negative CMF (-0.127), and a MACD still below its signal line all favor further downside or at best a sluggish bounce capped near $66. Oversold RSI and a narrowing MACD gap temper conviction, so the target is a moderate move below the current price.
This is educational analysis and not financial advice.