INTC 48-day bearish forecast — Nov 15, 2026
- Bias: Bearish
- Timeframe: 48 days (made Nov 15, 2026, target date Jan 1, 2027)
- Price at analysis: $59.66
- Price target: $55.00
- Expected range: $45.00 – $67.00
- Result: Pending — graded after the close on Jan 1, 2027
Get a free AI analysis of INTC today
Analysis
TECHNICAL INDICATORS
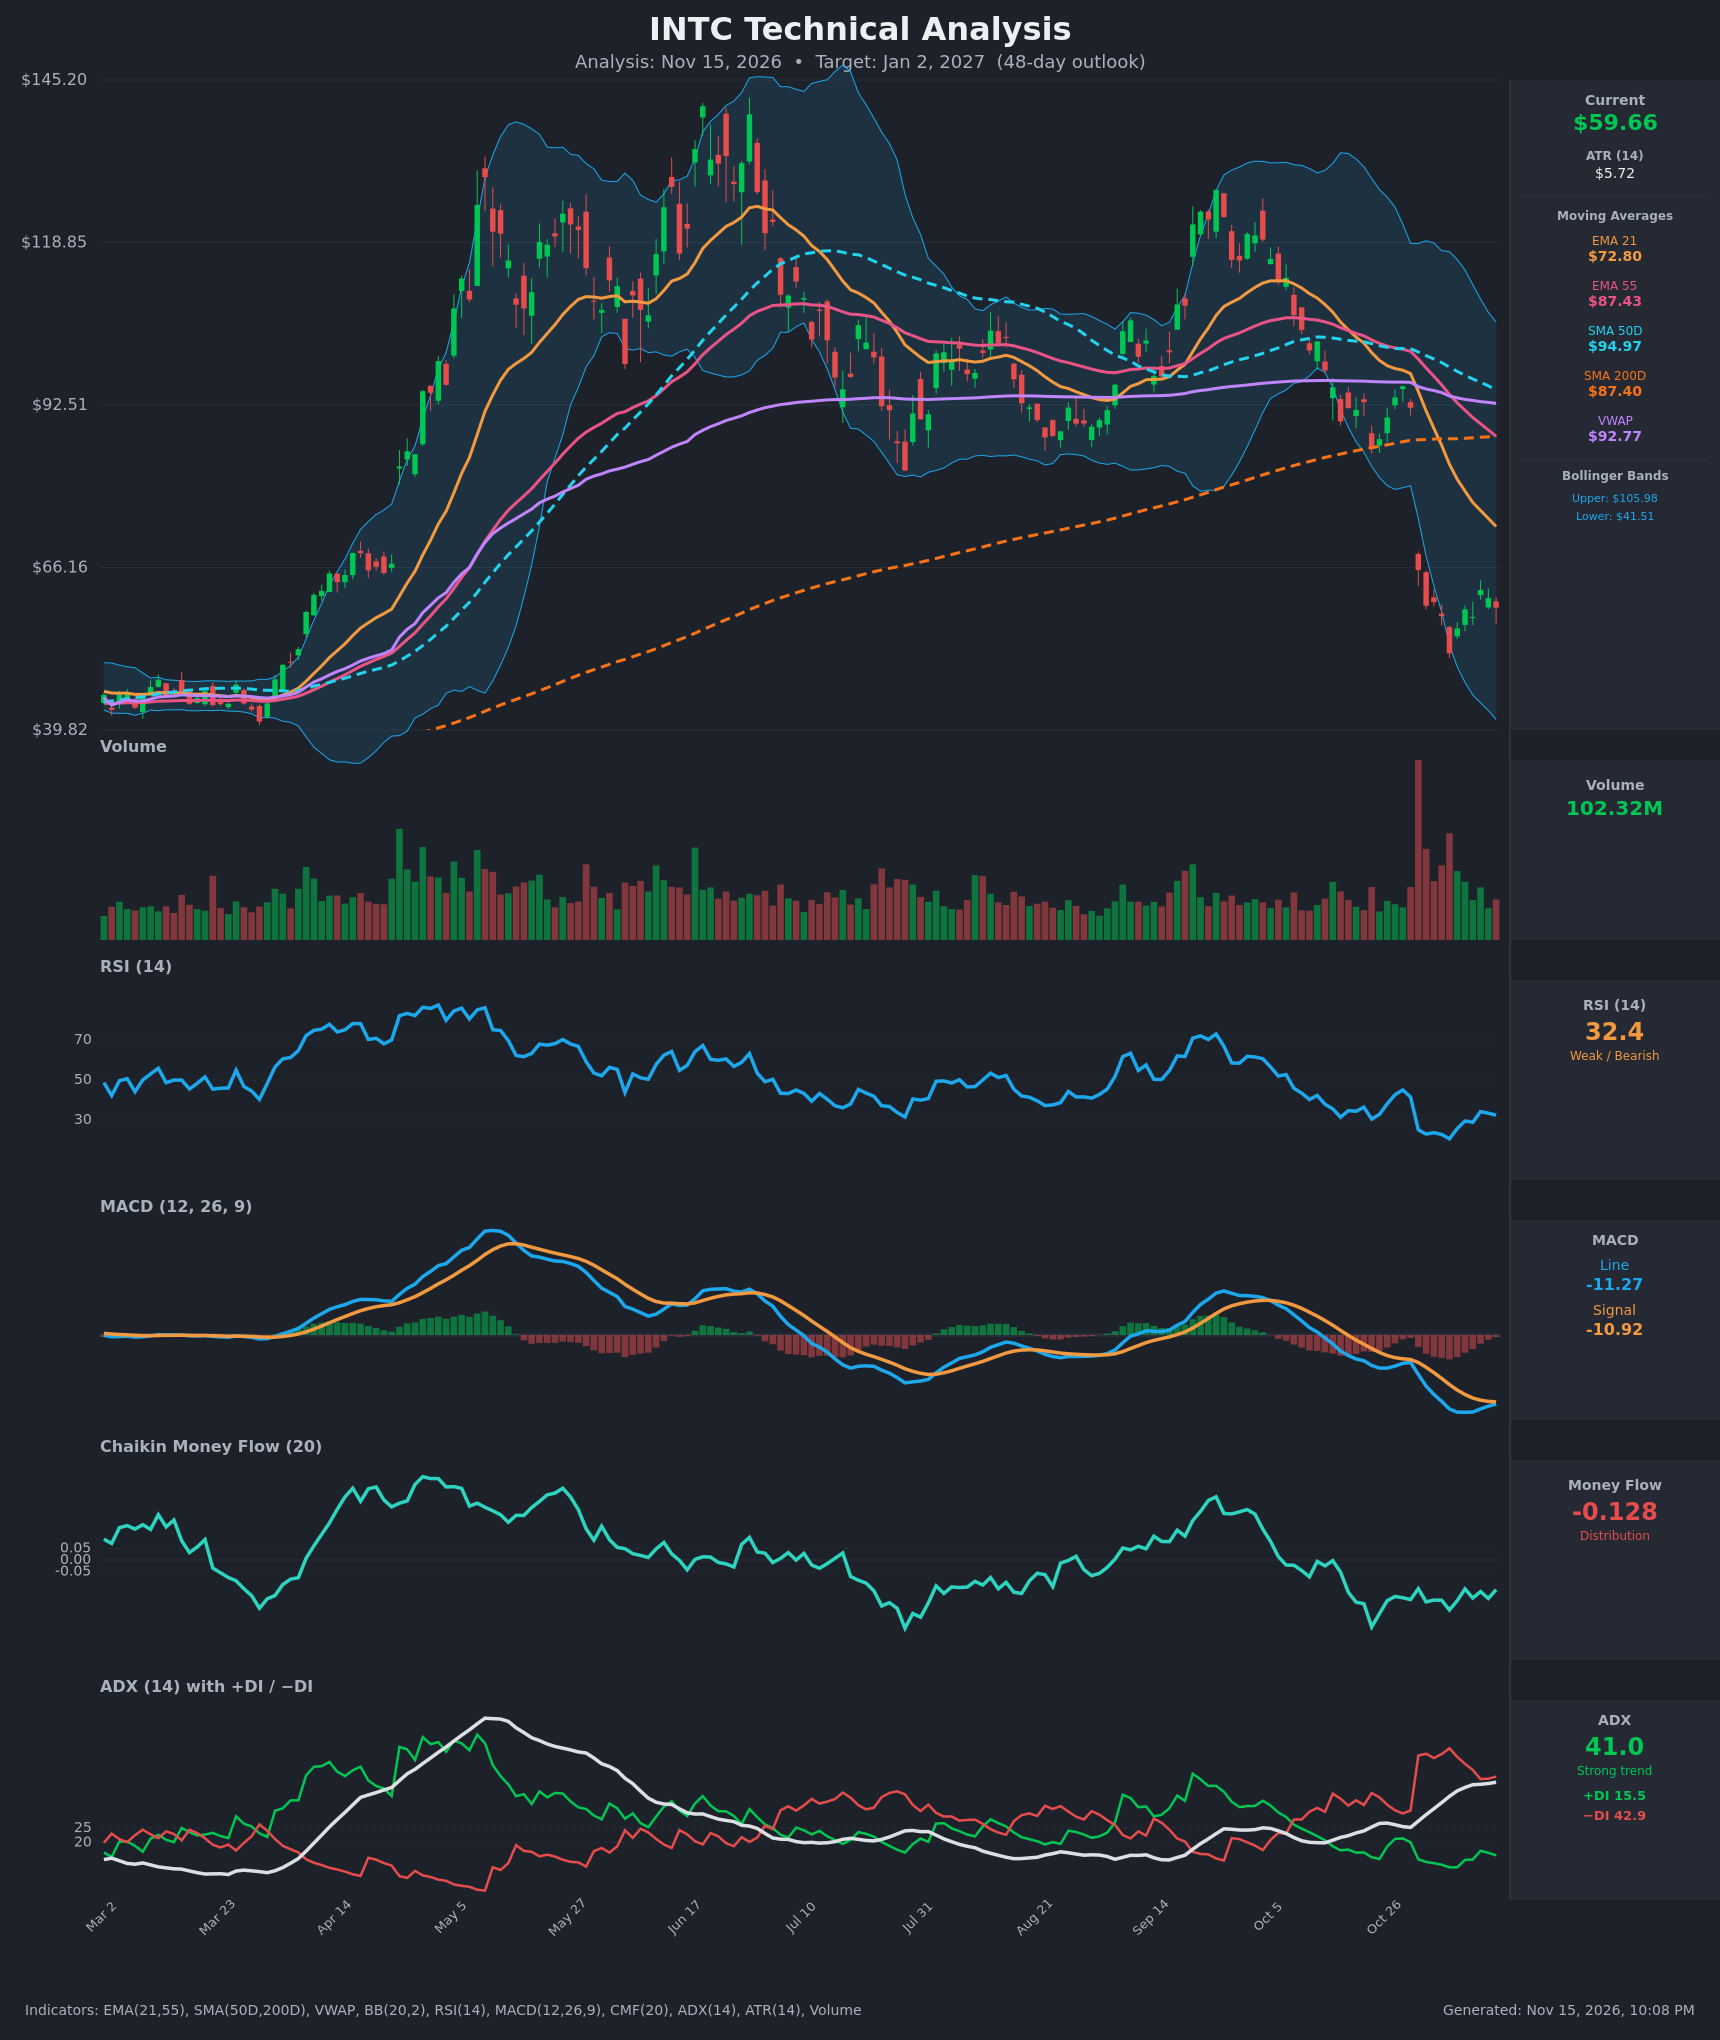
- RSI (14): 32.42, just above oversold. It dropped to 20.6 on Nov 5 and has bounced only modestly, making lower-high oscillations in the 29-34 zone. Momentum is weak and has not yet turned up convincingly. [Bearish]
- 20 EMA: The 21 EMA is $72.80 and falling fast. It is well above price at $59.66, about 22% overhead, so it acts as dynamic resistance. The EMA21 is also well below the EMA55 ($87.43), a bearish alignment. [Bearish]
- MACD: Line -11.27 vs signal -10.92, a bearish crossover that happened in early November. The histogram is slightly negative (about -0.34) and has narrowed from its deeper reading. The line is flattening, which hints at fading downside momentum but not a bullish cross. [Bearish]
- Bollinger Bands (20): Upper $105.98, lower $41.51, mid about $73.7. The bands are very wide after the Oct 30 gap-down (-29%). Price at $59.66 sits in the lower half, below the midline, and has pulled back from the lower band. Volatility is elevated, and the midline near $73-74 is the mean-reversion target. [Bearish]
- CMF (20): -0.128, below -0.05 and negative for the entire post-gap period. That is persistent distribution, with no sign of accumulation on the bounce. [Distribution]
- ADX (14): 41.0 and rising, which marks a strong trend. -DI at 42.9 is far above +DI at 15.5, so bears are firmly in control. The gap has narrowed slightly from the peak, but there is no DI crossover. [Strong Trend – Bearish]
- Volume: 102.32M on the latest bar, far above the typical 20-30M. The gap-down on Oct 30 showed a huge volume spike, and volume has stayed elevated since. This is capitulation-type volume, and the bounce attempts are on lower volume than the selloff. [Bearish with potential exhaustion]
DIVERGENCES & TRENDS
- No clear bullish RSI divergence yet. RSI made a low at 20.6 on Nov 5, while price made its low at $52.25 the same day. The later price retest at $58-59 came with RSI at 29-33, which is not a divergence, just a bounce.
- Moving-average structure is bearish: price ($59.66) < EMA21 ($72.80) < EMA55 ($87.43) < SMA200D ($87.40) < SMA50D ($94.97) < VWAP ($92.77). Price is about 32% below the SMA200D, an extreme stretch.
- The SMA50D remains above the SMA200D, but the gap is shrinking quickly (about $7.6). The SMA50D is rolling over, so a death cross is plausible within the 48-day window.
- EMA21 crossed below EMA55 in late October, a bearish cross that is still confirmed.
- MACD crossed bearish and is deeply negative. Its flattening is an early sign of decelerating momentum.
- ADX is rising above 40 with −DI dominant. This is a mature, strong downtrend, and ADX above 40 often signals trend exhaustion risk, so relief bounces are probable.
- Price is far below the BB midline, and mean-reversion rallies to the $68-73 area are possible. Still, the lower highs (Oct 26 to Nov 11) show sellers fading rallies.
CHART PATTERNS
- The dominant structure is a gap-down breakdown (≈-29%) from a multi-month range ($85-$125), consistent with the Bearish Head and Shoulders / Double Top family on the reference diagram. The Aug-Oct rally to about $125 lower-highed relative to the June peak of about $140, then broke down through support near $90 and through the SMA200D.
- Since the gap, price has been consolidating between about $52 and $65. This looks like a small Bearish Flag/Pennant or a basing range under a gap. The post-gap bounce is shallow, with lower highs near $62.50.
- Measured-move implication: a flag-pole of roughly $30 (from about $90 to $60) projected from a break of the $52 low would point toward $30-35, but this is an extreme target. The previous consolidation base near $40-45 (March-April) is a major support zone.
- A bullish alternative is a Double Bottom (lows $52.25 and about $58), but there is not yet a confirmed break above the neckline at about $62.50, and CMF/ADX do not support it.
POTENTIAL SCENARIOS
- Scenario 1: Bearish Continuation Lower — Price fails at the $62-65 resistance and the EMA21 (falling toward about $66 by year-end), re-tests and breaks the $52 low, and drifts toward the old base. CMF stays negative, −DI dominant, and a death cross forms. Trigger: daily close below $52.25. Target: $48 initially, then $42-45. Invalidation: daily close above $68 on rising volume. (50% probability)
- Scenario 2: Neutral/Bullish Relief Bounce then Range — Oversold RSI and a stretched price relative to the MAs fuel a mean-reversion bounce into the $66-73 zone (EMA21/BB midline), followed by rejection. Price stays largely between $52 and $72. Trigger: close above $62.50 with MACD histogram turning positive. Target: $68-72. Invalidation: close below $52. (30% probability)
- Scenario 3: Bullish Reversal — Capitulation volume marks a durable low and a double bottom forms. Price breaks the neckline and reclaims $75+. Trigger: close above $66 with CMF turning positive. Target: $78-82. Invalidation: close back below $58. (20% probability)
PRICE TARGETS
For the 48-day timeframe (30-60 day band, range width about 12-18%, widened slightly because of the extreme ATR/volatility):
- Target Price: $55.00 (below current, consistent with the bearish bias, about -7.8%)
- Expected Range: $45.00 to $67.00 (width $22.00 ≈ 36.9% of current price; wider than the typical 12-18% guidance because the ATR is about 9.6% of price and the BB width is huge, so a normal range would be too narrow. Self-check: this is much wider than a 2-3 day range, which is correct)
- Key Levels: Support at $52.25 (Nov 5 low), Resistance at $62.50 (Nov 11 high/neckline), then $72.80 (EMA21)
OVERALL BIAS
OVERALL BIAS: BEARISH - Price is below every major moving average, and ADX 41 with −DI at 42.9 vs +DI at 15.5 confirms a strong downtrend. CMF is persistently negative and MACD is bearish. Oversold conditions suggest relief bounces, but the trend and distribution favor lower prices over 48 days.
This is educational analysis and not financial advice.