MU 7-day bearish forecast — Oct 30, 2026
- Bias: Bearish
- Timeframe: 7 days (made Oct 30, 2026, target date Nov 6, 2026)
- Price at analysis: $882.86
- Price target: $868.00
- Expected range: $842.00 – $912.00
- Result: Correct (-21.5%) — closed at $692.85 on Nov 6, 2026; quality score 50/100
Get a free AI analysis of MU today
Analysis
TECHNICAL INDICATORS
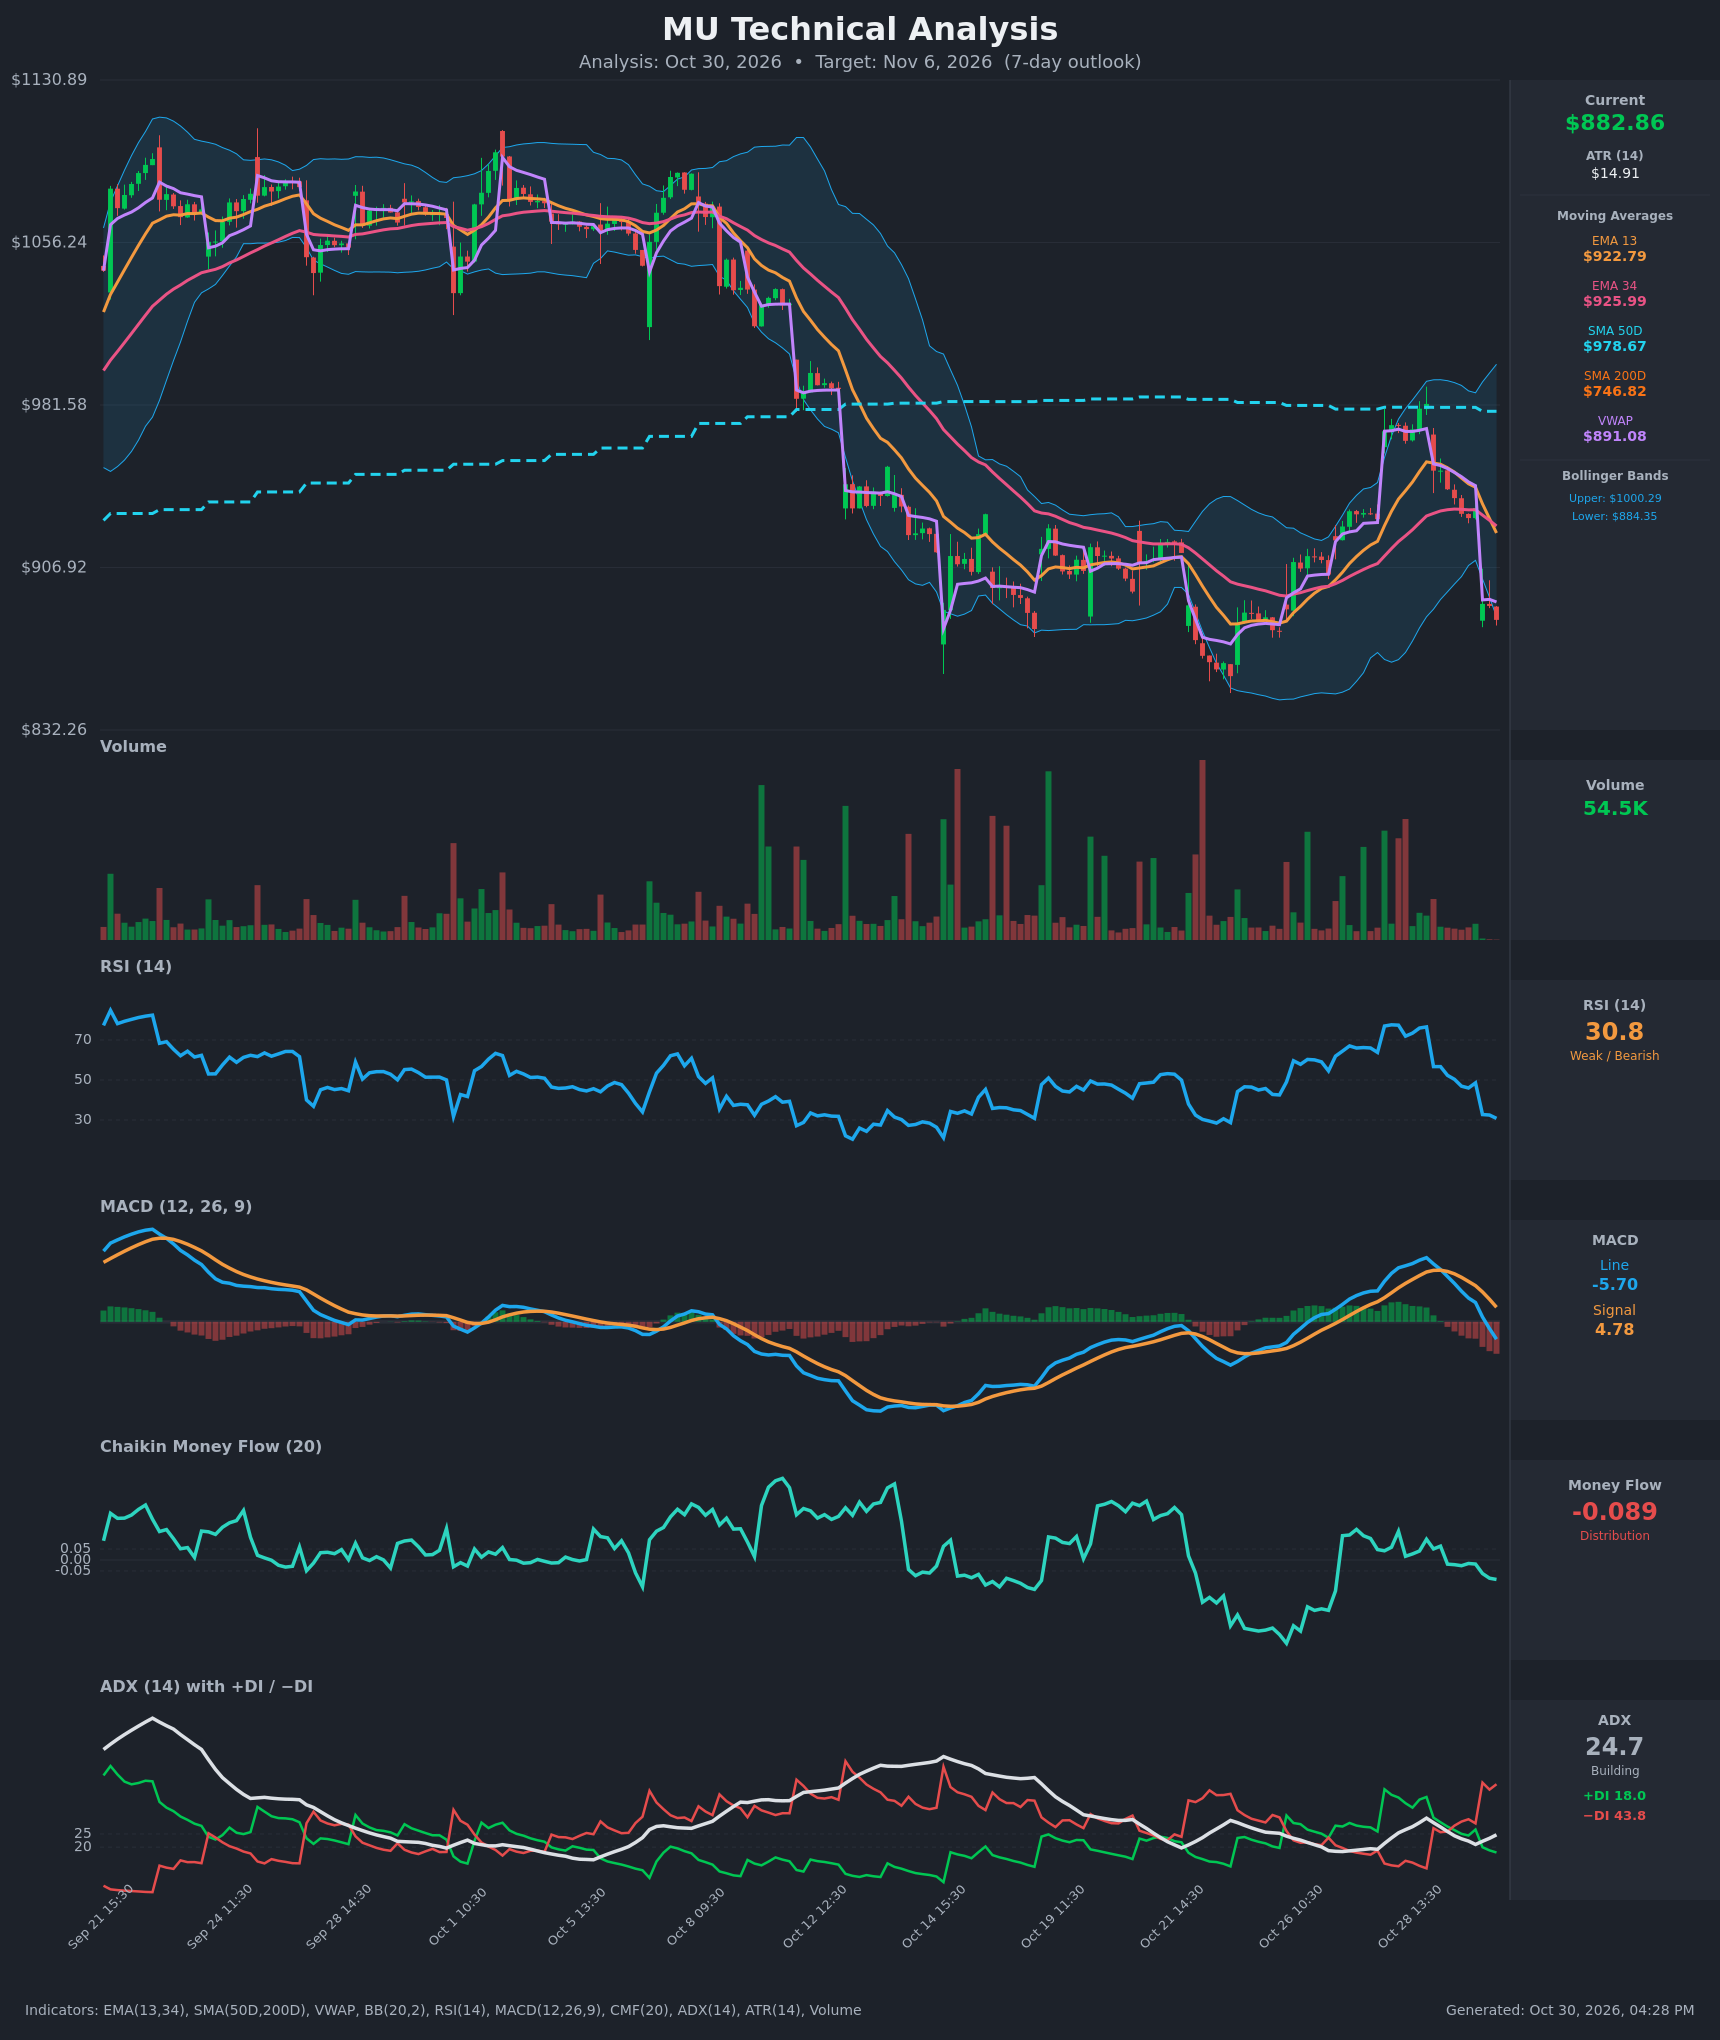
- RSI (14): 30.80, down from 77 on Oct 28 and sitting at the edge of oversold. The drop in about two sessions is very steep, and RSI has just broken below the prior 32 floor. It is close to a bounce zone but has not yet turned up. [Bearish]
- 20 EMA: The chart shows EMA 13/34 instead. EMA 13 is $922.79 and EMA 34 is $925.99. Price at $882.86 is about 4.3% below both, so they act as overhead resistance. EMA 13 has just crossed below EMA 34, a fresh bearish cross. [Bearish]
- MACD: Line is -5.70 against a signal of 4.78, a bearish crossover that happened on Oct 29. The line is now negative and still falling, and the histogram is increasingly negative. [Bearish]
- Bollinger Bands (20): Upper is $1000.29 and lower is $884.35. Price is slightly below the lower band after a gap down. That points to a stretched, high-volatility move. It can mean a mean-reversion bounce, but in a strong downtrend price can also "walk the band". [Neutral]
- CMF (20): -0.089, below -0.05 and falling after turning negative on Oct 29. It shows distribution, though it is not as deep as the Oct 22-23 trough. [Distribution]
- ADX (14): 24.7 and rising, just below the 25 trend threshold. −DI at 43.8 is far above +DI at 18.0, so sellers clearly dominate. The trend is becoming established in the bearish direction. [Strong Trend, bearish]
- Volume: 54.5K, a light reading on the latest bar. The Oct 30 gap down is not backed by heavy volume, so it is unclear whether it was driven by panic selling. Price is also below VWAP ($891.08), which shows intraday selling control. [Mildly bearish / low conviction]
DIVERGENCES & TRENDS
- There is no bullish RSI or MACD divergence yet. Price is making new local lows and RSI is making lower lows with it.
- Momentum reversed very sharply. RSI went from above 75 to about 31, and the MACD histogram flipped from strongly positive to negative.
- The DI cross on Oct 29 (−DI over +DI) was confirmed by the gap down on Oct 30. ADX is rising from a 21 low, which suggests a new bearish trend is building.
- EMA 13 has crossed below EMA 34, and price is below both and below VWAP.
- The rally to about $985 failed right at the SMA 50 ($978.67), which now acts as strong resistance. SMA 50 and SMA 200 are far apart, so there is no death cross. The long-term uptrend is still intact because price is well above the SMA 200 ($746.82).
- Price is at the lower Bollinger Band and RSI is near 30, so a short-term oversold bounce is plausible. The previous swing low near $850 is the key support.
CHART PATTERNS
- Since mid-October, price has been in a broad range of about $850 to $985. The rejection at the top came right at the SMA 50 and the upper band.
- The move from $985 down to $883 looks like a Bearish Double Top / lower-high reversal relative to the earlier peaks above $1050. The measured move would be a retest of the range low near $850.
- If $850 holds again, a Bullish Double Bottom could form, with the first low on Oct 22-23. The neckline would be around $925-$930, near the EMAs. This is only a secondary possibility until price bounces and confirms.
- The gap down and the rejection at the SMA 50 favor a retest of the range low over a quick recovery.
POTENTIAL SCENARIOS
- Scenario 1: Bearish Continuation to Range Low — Sellers stay in control, with −DI far above +DI and a negative MACD. Price tests the prior swing low and drifts below VWAP. Trigger: failure to reclaim VWAP at $891 and a hold below the lower Bollinger Band. Target: $850-$865. Invalidation: a close above $925 (EMA 34). (50% probability)
- Scenario 2: Bullish Oversold Bounce — RSI near 30 and a stretched move below the lower band trigger a relief rally. Price recovers toward the EMAs. Trigger: RSI turning up from 30 and a reclaim of $891 (VWAP). Target: $920-$925 (EMA 13/34). Invalidation: a break below $850. (33% probability)
- Scenario 3: Neutral Choppy Base — Price consolidates between about $860 and $905 as selling momentum fades. Trigger: ADX stalling below 25 and low volume. Target: $870-$895. Invalidation: a close outside the $850-$925 range. (17% probability)
PRICE TARGETS
- Target Price: $868.00 (7-day)
- Expected Range: $842.00 to $912.00. This is $70 wide, or about 7.9% of the current price, which fits the 7-10 day guidance.
- Key Levels: Support at $850.00, Resistance at $922.79
OVERALL BIAS
OVERALL BIAS: BEARISH - −DI at 43.8 dominates +DI at 18.0 with ADX rising. MACD has crossed bearishly and EMA 13 has crossed below EMA 34. CMF shows distribution, price is below VWAP, and the rally failed at the SMA 50. The oversold RSI near 30 limits the downside, so the target is a modest decline toward the $850 range low.
This is educational analysis and not financial advice.