MU 34-day bearish forecast — Nov 15, 2026
- Bias: Bearish
- Timeframe: 34 days (made Nov 15, 2026, target date Dec 18, 2026)
- Price at analysis: $778.31
- Price target: $735.00
- Expected range: $670.00 – $805.00
- Result: Pending — graded after the close on Dec 18, 2026
Get a free AI analysis of MU today
Analysis
TECHNICAL INDICATORS
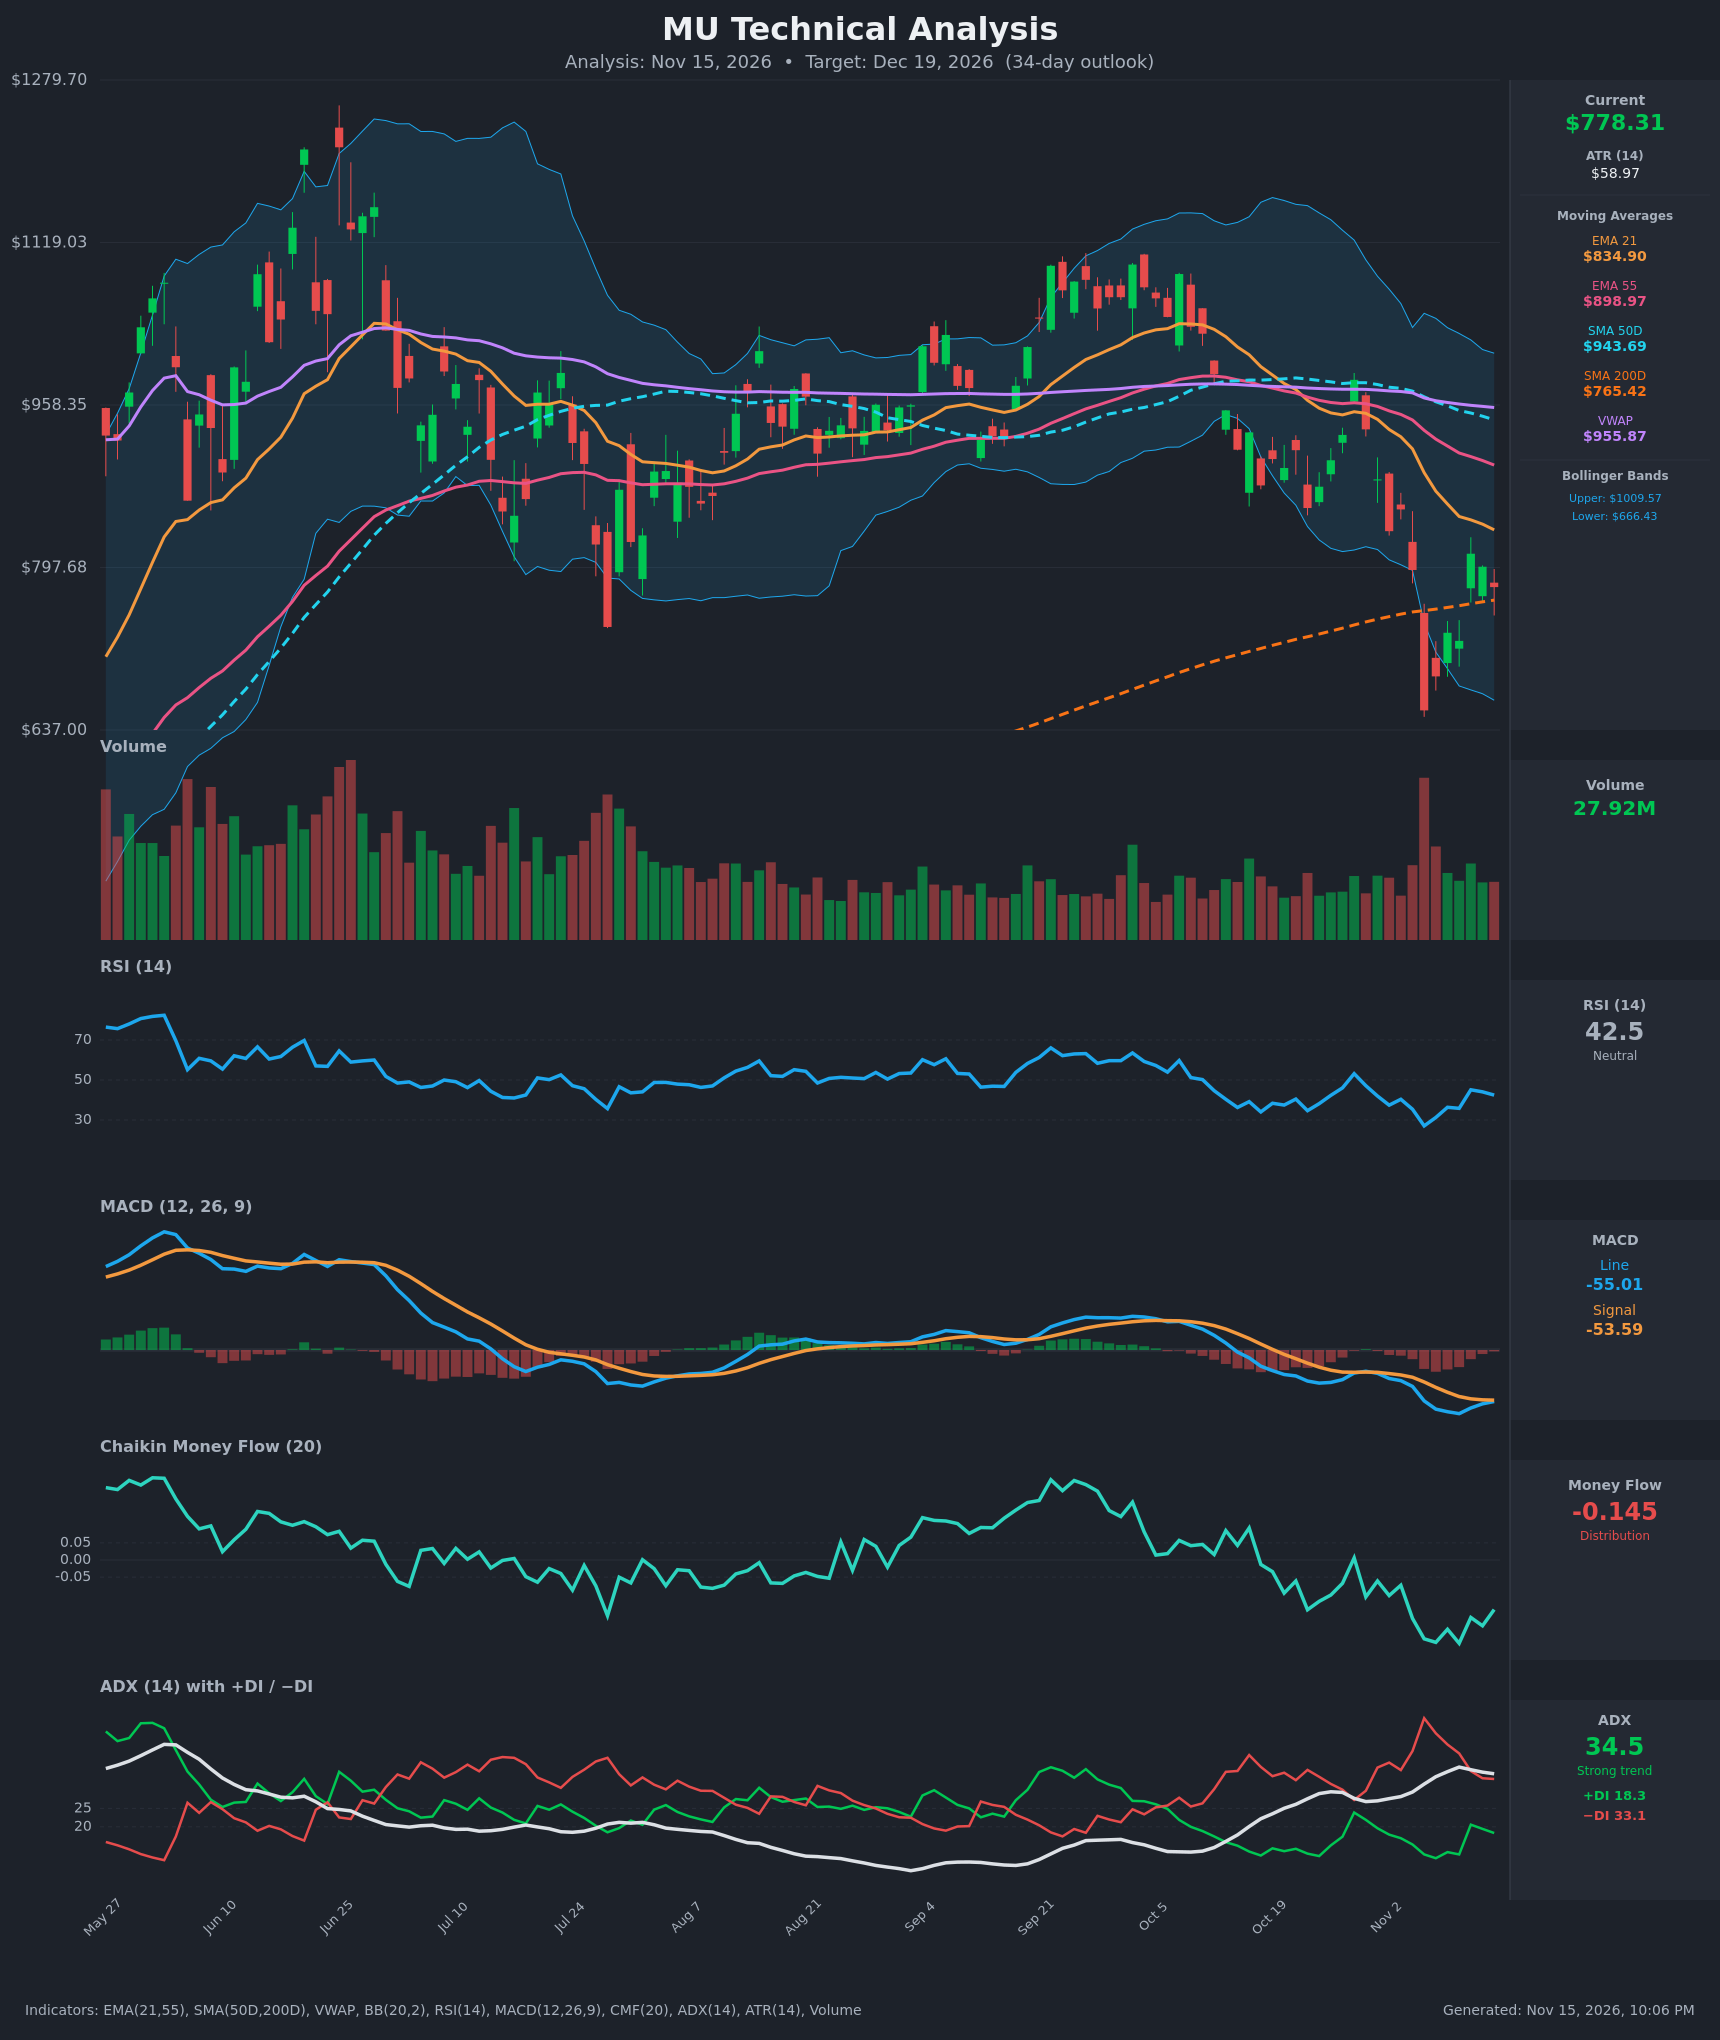
- RSI (14): 42.45, recovering from the oversold 27.1 low on Nov 5 but still below 50. The rebound has stalled in the low 40s (45.1 → 44.1 → 42.5), so momentum is rolling over again. [Bearish]
- 20 EMA (EMA 21): $834.90, about 7% above price and falling. Price has closed below it for 8 straight sessions, and the Nov 11 bounce to $811 failed to reach it. It is overhead resistance. EMA 55 ($898.97) is also falling, and EMA21 is well below EMA55, so the bearish alignment is intact. [Bearish]
- MACD: Line -55.01 vs signal -53.59, a histogram of about -1.4. The line is below zero and below the signal. It has bounced from -67.98 and the histogram is shrinking, so a bullish crossover is close. That would only be a relief signal while both lines stay deeply negative. [Bearish]
- Bollinger Bands (20): Upper $1009.57, lower $666.43, so the bands are very wide after the volatility spike. Price at $778 sits in the lower half, below the midline (about $838). The Nov 5 close of $656 pierced the lower band and bounced back inside. [Bearish]
- CMF (20): -0.145, well below the -0.05 threshold. It has been negative for the whole decline and got as low as -0.243, so distribution has not reversed. The small uptick is not enough to call a change. [Distribution]
- ADX (14): 34.5, a strong trend, with −DI at 33.1 above +DI at 18.3. ADX has eased from 36.3 and is flattening, but the bears remain firmly in control of the trend. [Strong Trend – Bearish]
- Volume: 27.92M. Volume spiked on the Nov 5 capitulation candle, and the bounce sessions had noticeably lighter volume. Relief rallies on weaker volume lack conviction. [Mildly Bearish]
Other levels:
- Price is below SMA50D ($943.69) and VWAP ($955.87), both of which are overhead resistance.
- Price is just above SMA200D ($765.42), which is the last major support. Price is only about 1.7% above it.
- SMA50D is above SMA200D, so the golden-cross structure has not yet broken. The gap is narrowing quickly (SMA50D is falling and SMA200D is rising), so a death cross is a risk over the coming weeks.
DIVERGENCES & TRENDS
- No clear bullish divergence. RSI made a higher low (27.1 → 35.8), but price also made a higher low ($656 → $725), and the rebound is already fading.
- The MACD histogram is contracting. A bullish crossover is likely within days, but it would come from a deeply negative level.
- The ADX peaked at 36.3 and is rolling over slightly while −DI stays dominant. This suggests the sell-off is maturing but not reversed.
- CMF has trended down from positive in September to -0.145, which confirms the price decline.
- Price made lower highs ($983 on Oct 28 → $811 on Nov 11) and has lost the EMA21, EMA55, SMA50D and VWAP. The only level still holding is SMA200D.
CHART PATTERNS
- The sharp drop to $656 followed by a weak, low-volume bounce under falling EMAs looks like a Bearish Flag / Bearish Pennant continuation pattern. This is a tentative read because the consolidation is short. The measured move from the flagpole (about $983 → $656) would point toward the $600 area if SMA200 support breaks.
- At a larger scale, the peaks in June (about $1240) and Sep/Oct (about $1100) with a lower second high resemble a loose Bearish Double Top. A confirmed break below the Nov 5 low of about $656 would validate it.
- The bullish alternative is a Double Bottom forming at the $656–$725 area. It is unconfirmed, because price would need to clear about $811–$835 first.
POTENTIAL SCENARIOS
- Scenario 1: Bearish Failed Relief Rally and SMA200 Breakdown — The bounce stalls below the falling EMA21, the MACD crossover fails to attract buyers, and price loses the SMA200 support zone. Sellers then retest the capitulation low. Trigger: daily close below $765 with −DI still above +DI. Target: $690–$725, with an extension to $656–$670. Invalidation: daily close above $835 (EMA21). (50% probability)
- Scenario 2: Bullish Double-Bottom Relief Rally — The SMA200 holds, the MACD crosses up, and price squeezes back toward the EMA21 and the gap area. Trigger: close above $811–$835 on rising volume. Target: $870–$900 (EMA55). Invalidation: close below $740. (28% probability)
- Scenario 3: Neutral Choppy Base Between SMA200 and EMA21 — Price oscillates around the SMA200 while volatility contracts. Trigger: ADX falls below 25 and CMF moves back toward 0. Target: $740–$830. Invalidation: a decisive close outside that band. (22% probability)
PRICE TARGETS
- Target Price: $735.00 (34-day, about -5.6% from $778.31)
- Expected Range: $670.00 to $805.00 (width $135, about 17.3%, in line with the 30–60 day guidance of 12–18%)
- Key Levels: Support at $765.42 (SMA200D), with deeper support at $656.00 (Nov 5 low). Resistance at $834.90 (EMA21).
OVERALL BIAS
OVERALL BIAS: BEARISH - Price is below the EMA21, EMA55, SMA50D and VWAP. ADX at 34.5 with −DI well above +DI confirms a strong downtrend, and CMF at -0.145 shows persistent distribution. The oversold bounce is fading on light volume and sits just above SMA200 support, so a break of that level is the more likely outcome. A relief rally toward $835 is the main risk.
This is educational analysis and not financial advice.