MU 20-day bearish forecast — Nov 15, 2026
- Bias: Bearish
- Timeframe: 20 days (made Nov 15, 2026, target date Dec 4, 2026)
- Price at analysis: $778.31
- Price target: $745.00
- Expected range: $675.00 – $815.00
- Result: Pending — graded after the close on Dec 4, 2026
Get a free AI analysis of MU today
Analysis
TECHNICAL INDICATORS
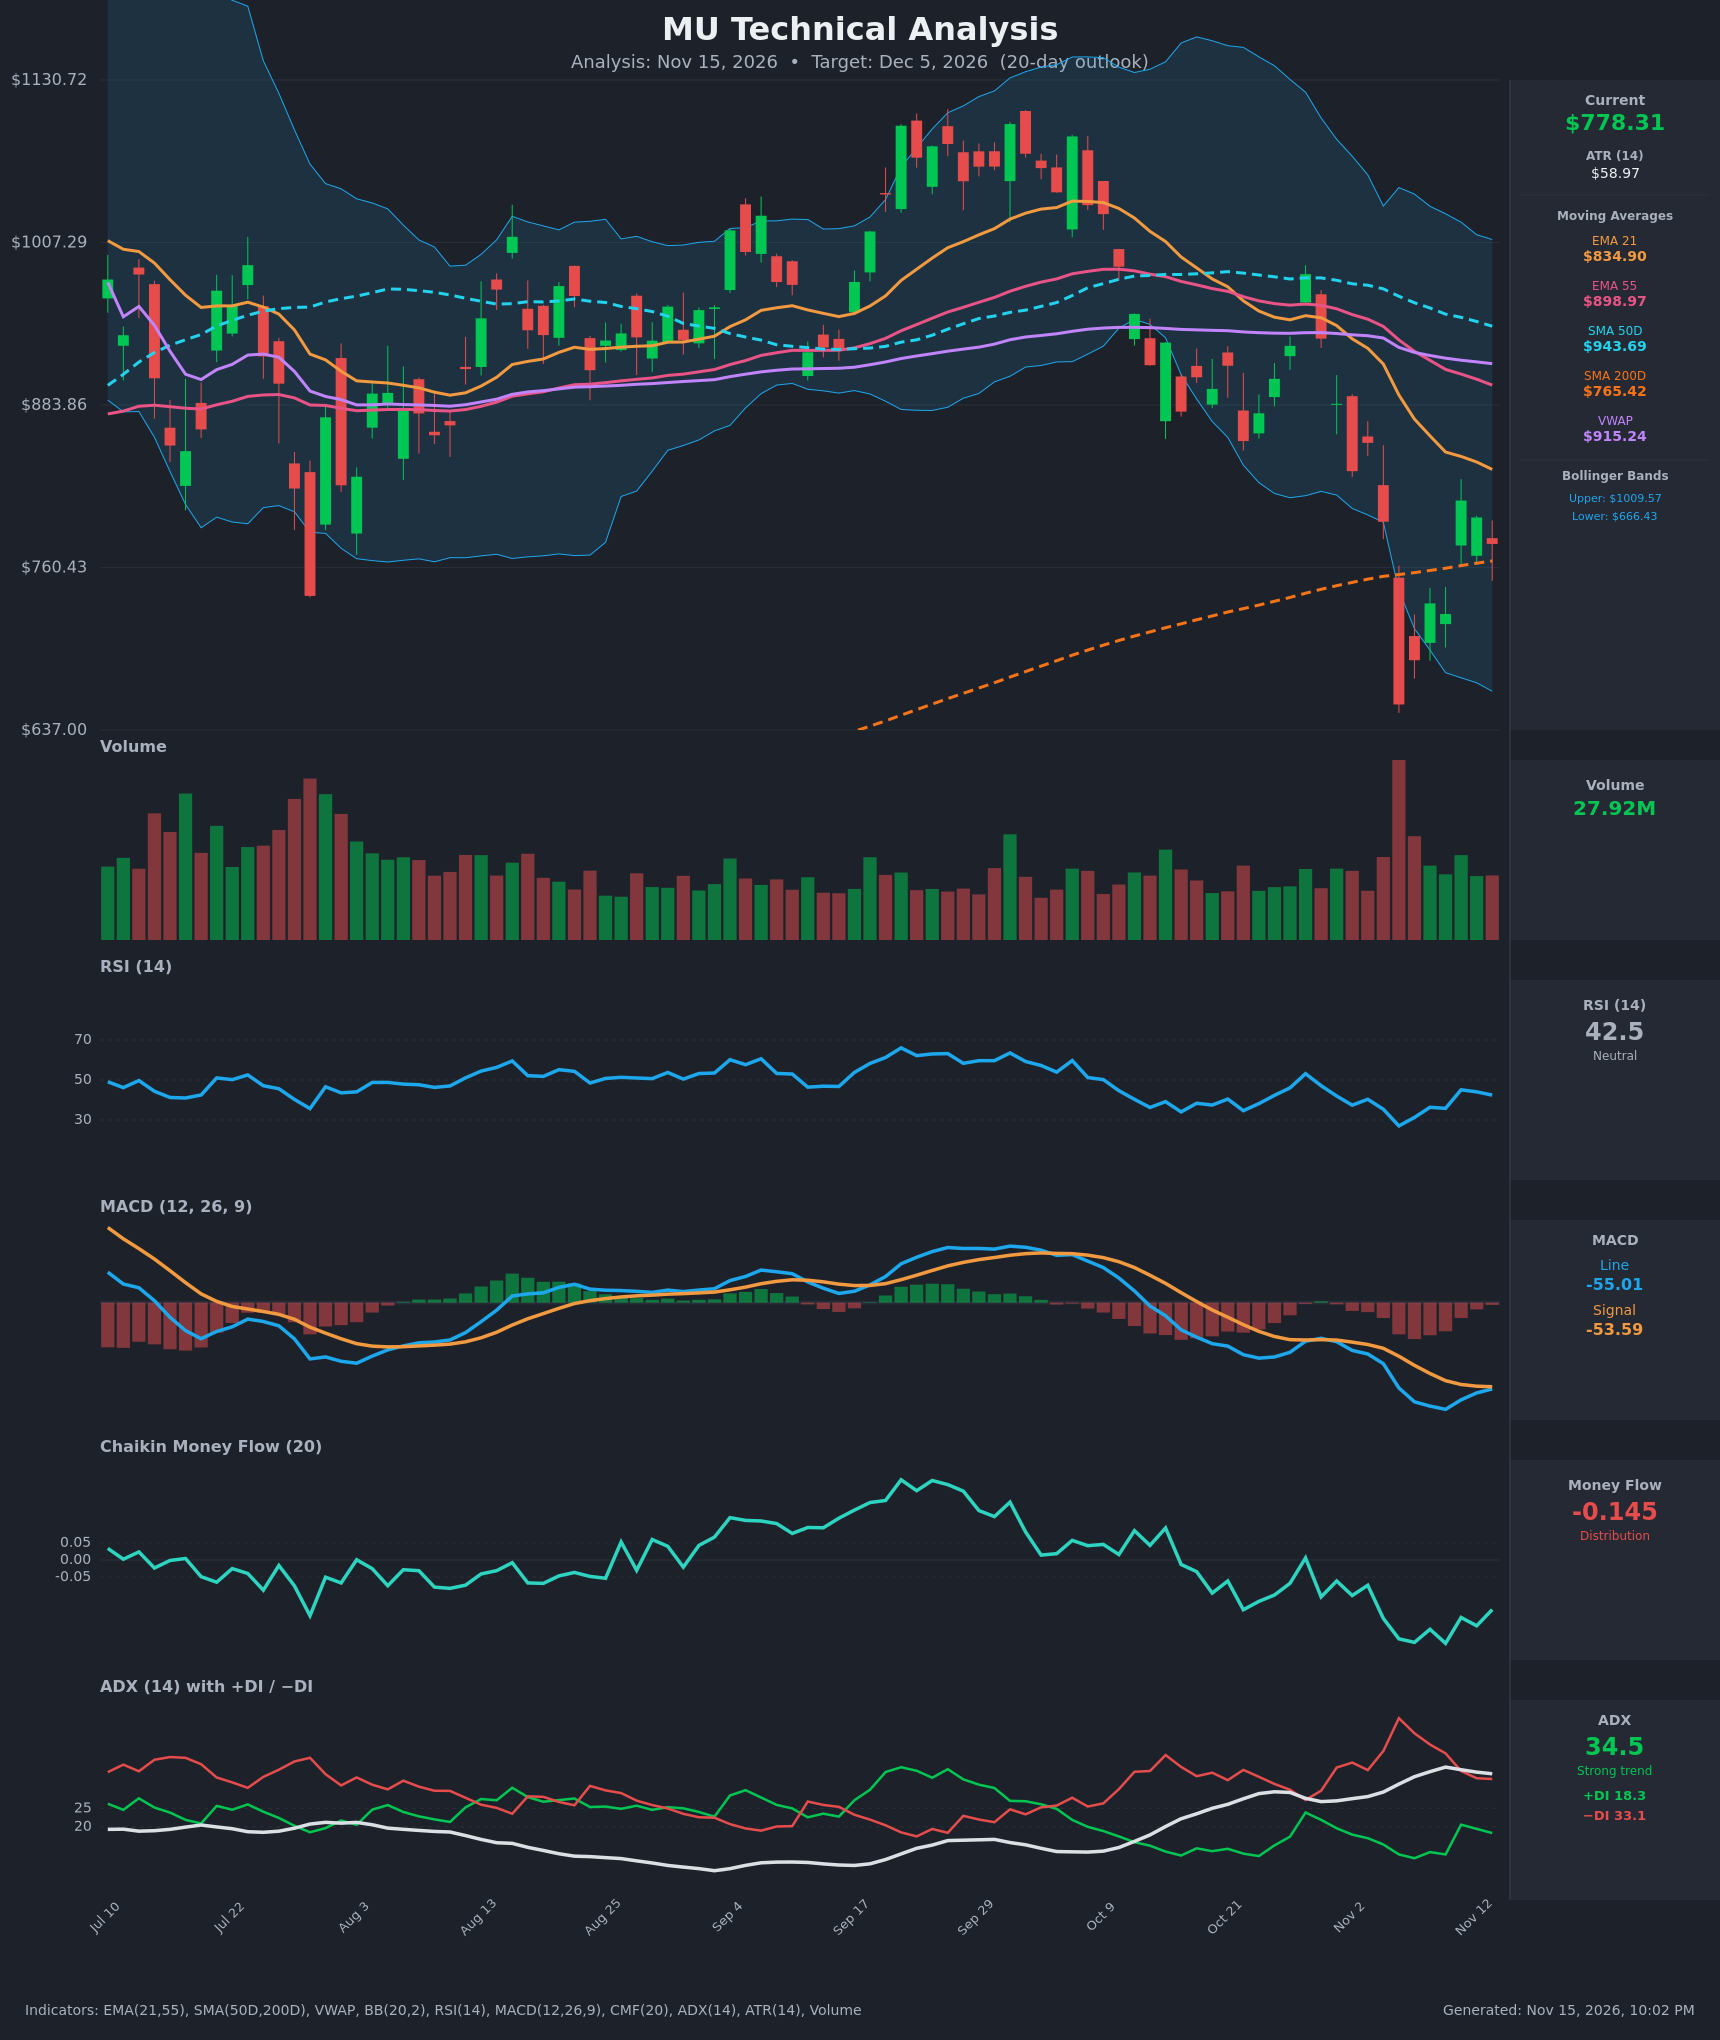
- RSI (14): 42.45, below the 50 midline and recovering from the oversold 27.1 low on Nov 5. It has bounced but is still capped under 50 and is not showing strength. [Bearish]
- 20 EMA (EMA 21): $834.90, with price at $778.31 about 6.8% below it. The EMA is falling quickly (from $950 to $835 in two weeks) and acts as overhead resistance. EMA 55 ($898.97) is also falling and sits well above price. [Bearish]
- MACD: Line -55.01 is just above Signal -53.59, a marginal and tentative bullish crossover. Both lines are deeply negative. The histogram is about -1.4 and narrowing, so downside momentum is fading but there is no real bullish confirmation. [Neutral]
- Bollinger Bands (20): Upper $1009.57, lower $666.43, midline about $838. Price is in the lower half, about 33% of the band width from the bottom. The bands are wide after the Nov 5 flush to $656 (below the lower band). Price is rebounding but stays below the midline. [Bearish]
- CMF (20): -0.145, clearly below -0.05. It has stayed negative for weeks with only a slight bounce from -0.24, so selling pressure persists. [Distribution]
- ADX (14): 34.5 with −DI 33.1 over +DI 18.3. This is a strong trend with bears in control. ADX is still elevated but has started to flatten and roll over (36.3 → 34.5), and −DI is easing off its 49.7 peak. [Strong Trend – Bearish]
- Volume: 27.92M, normal for recent sessions and well below the capitulation spike on Nov 5. Bounce volume is moderate and does not show strong dip-buying. [Neutral to mildly Bearish]
DIVERGENCES & TRENDS
- Trend structure: The stock peaked near $1,100 in late Sep/early Oct and is now in a clear lower-high, lower-low downtrend. It lost the EMA 21, EMA 55, SMA 50D and VWAP ($915) in succession.
- Moving-average stack: Price ($778) < EMA21 ($835) < EMA55 ($899) < VWAP ($915) < SMA50D ($944). Only the SMA 200D ($765) is below price, and it is rising. The gap between price and SMA 200D is just $13, making it the last major support.
- Crossovers: EMA21 crossed below EMA55 around Oct 9–Nov, confirming the bearish medium-term trend. The SMA 50D remains above the SMA 200D, so there is no death cross yet, but the gap is narrowing ($944 vs $765) and the SMA 50D is rolling over.
- MACD: Only a marginal bullish crossover (line -55.0 vs signal -53.6) at deeply negative levels. This is a weak signal and could easily fail.
- Divergence: Price on Nov 13 ($778) is above the Nov 5 low ($656), while RSI is higher (42 vs 27). This is a recovery from oversold, not a true bullish divergence. Price is also making lower highs on the bounce (Nov 11 $811 → Nov 13 $778).
- ADX/DI: −DI is falling from 49.7 to 33.1 and ADX is rolling over. The selling is losing intensity, but +DI at 18.3 shows no bullish takeover.
CHART PATTERNS
- Bearish Flag / Rising Wedge-style relief bounce: The sharp drop to $656 followed by a weak bounce to $811 and a fade resembles a bearish flag (continuation lower). The measured move from the Oct–Nov decline points toward the $650–$700 area.
- Lower-high structure: The decline from ~$1,100 resembles a larger Bearish Head and Shoulders / double-top reversal from the Sep–Oct highs. The neckline in the $880–$900 area broke in early November, confirming the reversal. The measured target is far below.
- Key test: The SMA 200D at ~$765 is the line in the sand. The Nov 5 wick to $656 and the quick recovery above it show buyers defending the area, so the pattern could turn into a base (a Bullish Double Bottom at $656–$690 if retested and held). That is not yet confirmed.
POTENTIAL SCENARIOS
- Scenario 1: Bearish Continuation Lower — Price fails at the EMA 21/$810–$835 zone, loses the SMA 200D (~$765), and retests the Nov 5 low area. CMF stays negative and −DI stays dominant. Trigger: daily close below $760 on rising volume. Target: $680–$700, with an extension to $656. Invalidation: daily close above $835 (EMA 21). (50% probability)
- Scenario 2: Bullish Relief Rally / Double Bottom — Price holds the SMA 200D, MACD confirms the crossover, and the stock squeezes back toward the EMA 21 and the Bollinger midline. Trigger: close above $811 (Nov 11 high) with volume. Target: $835–$880. Invalidation: close below $730. (30% probability)
- Scenario 3: Neutral Range Consolidation — Price chops between the SMA 200D support and the $811–$835 resistance as ADX cools. Trigger: failure to break either side for several sessions. Target: $750–$810. Invalidation: close outside $730–$840. (20% probability)
PRICE TARGETS
For the 20-day timeframe (target date Dec 5, 2026), the range width should be about 8–12% of price (~$62–$93 at minimum), and given ATR $59 and the elevated volatility I use a somewhat wider range of about 18% (~$140).
- Target Price: $745.00
- Expected Range: $675.00 to $815.00 (width $140 ≈ 18% of current price)
- Key Levels: Support at $765.00 (SMA 200D; secondary at $656.00), Resistance at $835.00 (EMA 21)
Note: The SMA 200D at $765.42 is $13 below current price and is the nearest support, so I list it as Support. The Nov 5 low at $656 is the deeper level. Resistance at $835 is above current price.
OVERALL BIAS
OVERALL BIAS: BEARISH - Price sits below every short- and medium-term moving average with −DI dominating (33.1 vs 18.3), ADX at 34.5, and persistent negative CMF (-0.145). The bounce is stalling under the falling EMA 21, and the thin SMA 200D support at ~$765 is likely to be tested and probably lost. The marginal MACD crossover and oversold bounce are the main counter-signals.
This is educational analysis and not financial advice.