MU 83-day bearish forecast — Nov 15, 2026
- Bias: Bearish
- Timeframe: 83 days (made Nov 15, 2026, target date Feb 5, 2027)
- Price at analysis: $778.31
- Price target: $722.00
- Expected range: $630.00 – $825.00
- Result: Pending — graded after the close on Feb 5, 2027
Get a free AI analysis of MU today
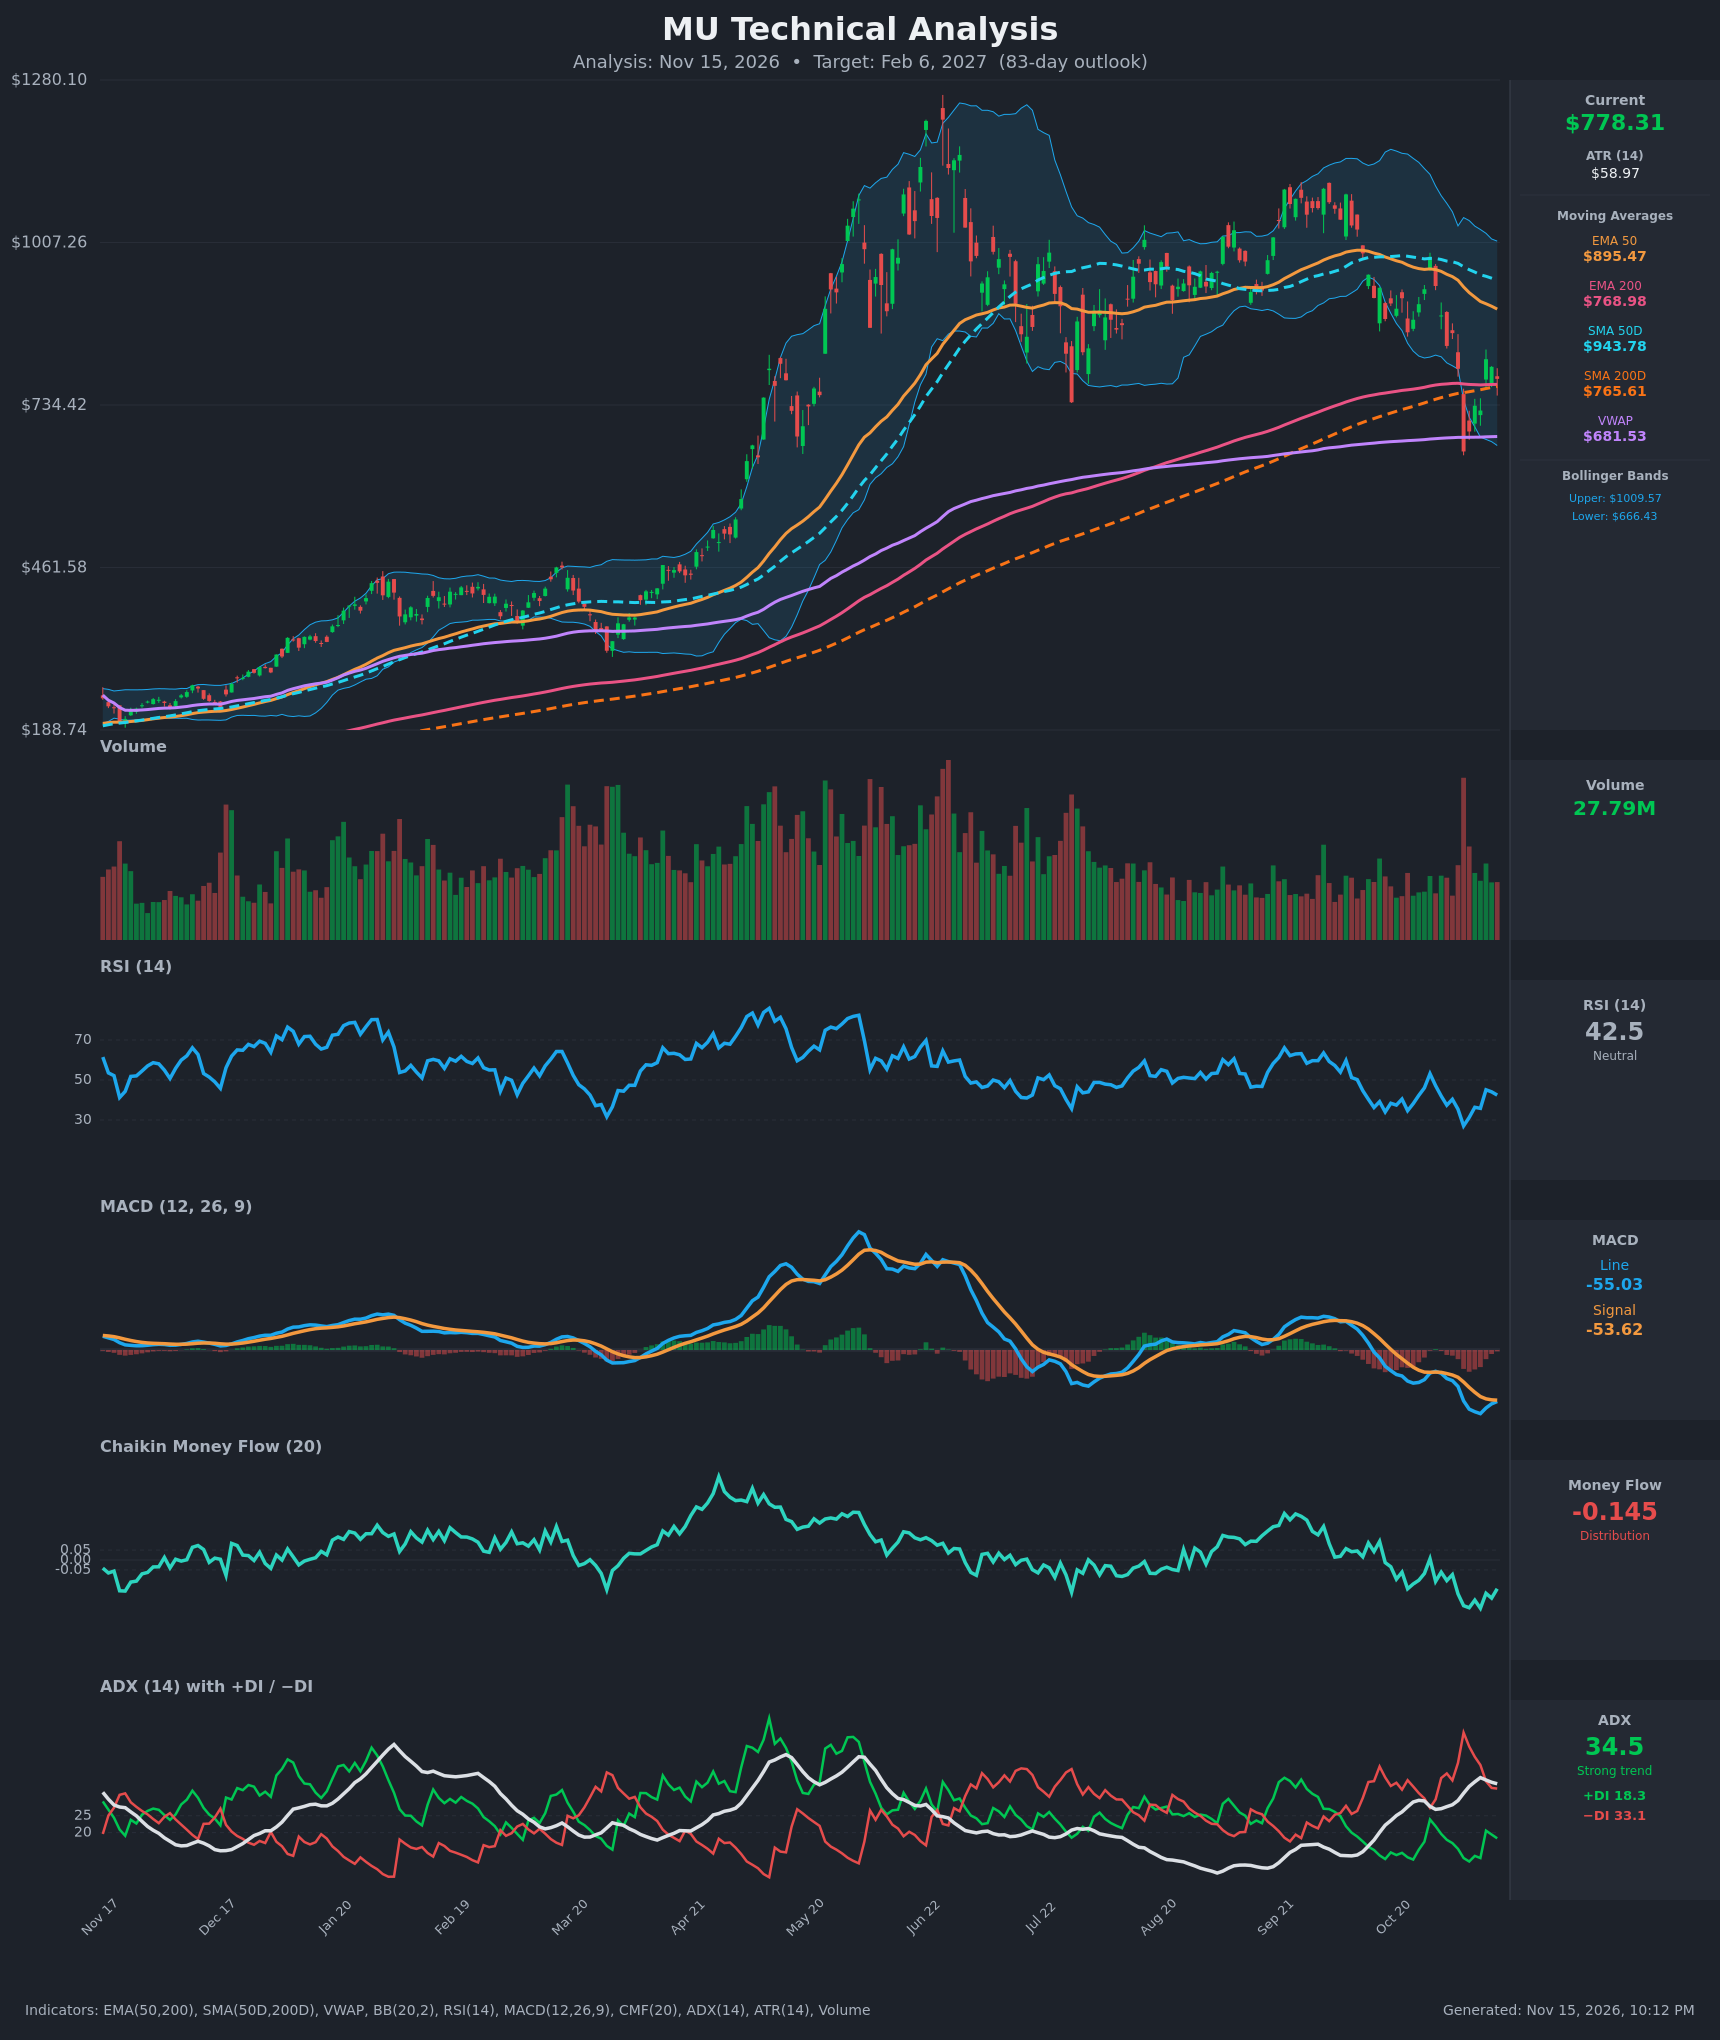
Analysis
TECHNICAL INDICATORS
- RSI (14): 42.45. It bounced from deeply oversold (27.1 on Nov 5) but has stalled below 50 and is rolling over from 45.1 (Nov 11). Momentum is recovering but weak. [Bearish]
- 20 EMA: The 20 EMA isn't supplied, so I'm using the EMA 50 at $895.47 and EMA 200 at $768.98. Price ($778.31) is far below the falling EMA 50, which acts as overhead resistance. It sits only about 1% above the EMA 200, which is the last line of support. [Bearish]
- MACD: Line -55.03 vs signal -53.62, a histogram of about -1.4. The line is deeply negative and below the signal, with no bullish cross yet. The histogram has narrowed sharply from about -20 on Nov 10, which hints at a base but not a reversal. [Bearish]
- Bollinger Bands (20): Upper $1009.57, lower $666.43, midline roughly $838. Price is in the lower half, below the midline, after a Nov 5 close well under the lower band (at $656) and a snap-back inside. Band width is still wide, which signals high volatility and a failed mean-reversion bounce so far. [Bearish]
- CMF (20): -0.145, well below -0.05 and has been negative since late October. That shows persistent distribution, and the bounce hasn't improved it. [Distribution]
- ADX (14): 34.5 with −DI (33.1) far above +DI (18.3). The trend is strong and bearish. ADX has eased slightly from 36.3 and the DI gap is narrowing, so selling pressure is cooling, but bears remain in control. [Strong Trend – Bearish]
- Volume: 27.79M. Volume spiked on the Nov 5 capitulation candle (a large red bar), and the rebound has come on fading volume. That suggests a relief bounce rather than strong accumulation. [Bearish-leaning / relief bounce]
DIVERGENCES & TRENDS
- No clear bullish divergence: RSI made a higher low (27.1 vs 35.4 the prior leg), but price and MACD both made new lows, and the MACD line is at a multi-month low. This is a mild momentum-stabilization clue at best.
- Trend structure: Lower highs since the June peak near $1,250 and a lower swing high around $1,180 in September. The $735 July low was broken on Nov 5.
- MA structure: SMA 50 ($943.78) is falling toward SMA 200 ($765.61), and EMA 50 ($895.47) is falling toward EMA 200 ($768.98). No death cross yet, but both pairs are converging. A cross within the 83-day window is plausible if price stays under $800.
- Price vs 200s: Price is hugging the SMA/EMA 200 (about $766–769). Both are rising, which is the main support.
- DI/ADX: −DI has been above +DI since early Nov. The gap is narrowing (−DI was 49.7 on Nov 5), so downside momentum is fading, but a +DI crossover is not close.
- Money flow: CMF has fallen from positive in September to -0.145, confirming distribution on the way down.
CHART PATTERNS
- Bearish Head and Shoulders (broad, developing): Left shoulder in the first half of the year, a head near $1,250 in June, and a lower right shoulder near $1,180 in September. The neckline is around $730–740 (the July low). The Nov 5 break to $656 pierced it, and the current bounce to $778–811 looks like a neckline retest from the underside. The full measured move (head minus neckline, about $515) would project far lower. That is unrealistic for 83 days, but it supports a downside bias with partial targets near $656 and the low $600s.
- Larger context: The failed bounce is also consistent with a bearish expanding or flag-type retest after a steep fall. A close above $895 (EMA 50) would invalidate the bearish structure.
POTENTIAL SCENARIOS
- Scenario 1: Bearish Neckline Retest Failure — Price fails near $811–850, loses the $766–769 200-day MA cluster, and revisits the Nov 5 low. A death cross forms as the 50s keep rolling over. Trigger: daily close below $765. Target: $656 first, then $600–630. Invalidation: daily close above $895. (50% probability)
- Scenario 2: Bullish Relief Rally / Base Above 200s — The 200-day MAs hold, MACD crosses up, RSI reclaims 50, and CMF turns toward neutral. Price rallies back to the declining EMA 50. Trigger: close above $811 and then $850 with rising volume. Target: $895–$940 (EMA 50, SMA 50 area). Invalidation: close below $740. (33% probability)
- Scenario 3: Neutral Chop Between the 200s and $850 — Price consolidates between about $700 and $850 while the moving averages converge. Trigger: ADX fading below 25 and volume contracting. Target: about $770–790. Invalidation: close outside $680–$870. (17% probability)
PRICE TARGETS
- Target Price: $722.00 (83-day, Feb 6, 2027)
- Expected Range: $630.00 to $825.00 (width $195, about 25% of current price, consistent with the 61–180 day guidance)
- Key Levels: Support at $765.61 (SMA 200, with EMA 200 at $768.98; below that, $656.39 Nov low), Resistance at $811.30 (recent swing high; above that, $895.47 EMA 50)
OVERALL BIAS
OVERALL BIAS: BEARISH - Price is below the falling 50-day averages. MACD is negative, CMF shows distribution, and −DI dominates a strong ADX of 34.5. The structure looks like a broken head-and-shoulders neckline being retested, with the 200-day MAs at about $766 the only meaningful support.
This is educational analysis and not financial advice.