INTC 4-day bullish forecast — Oct 31, 2026
- Bias: Bullish
- Timeframe: 4 days (made Oct 31, 2026, target date Nov 3, 2026)
- Price at analysis: $65.88
- Price target: $67.20
- Expected range: $63.90 – $68.10
- Result: Incorrect (-8.1%) — closed at $60.55 on Nov 3, 2026; quality score 0/100
Get a free AI analysis of INTC today
Analysis
TECHNICAL INDICATORS
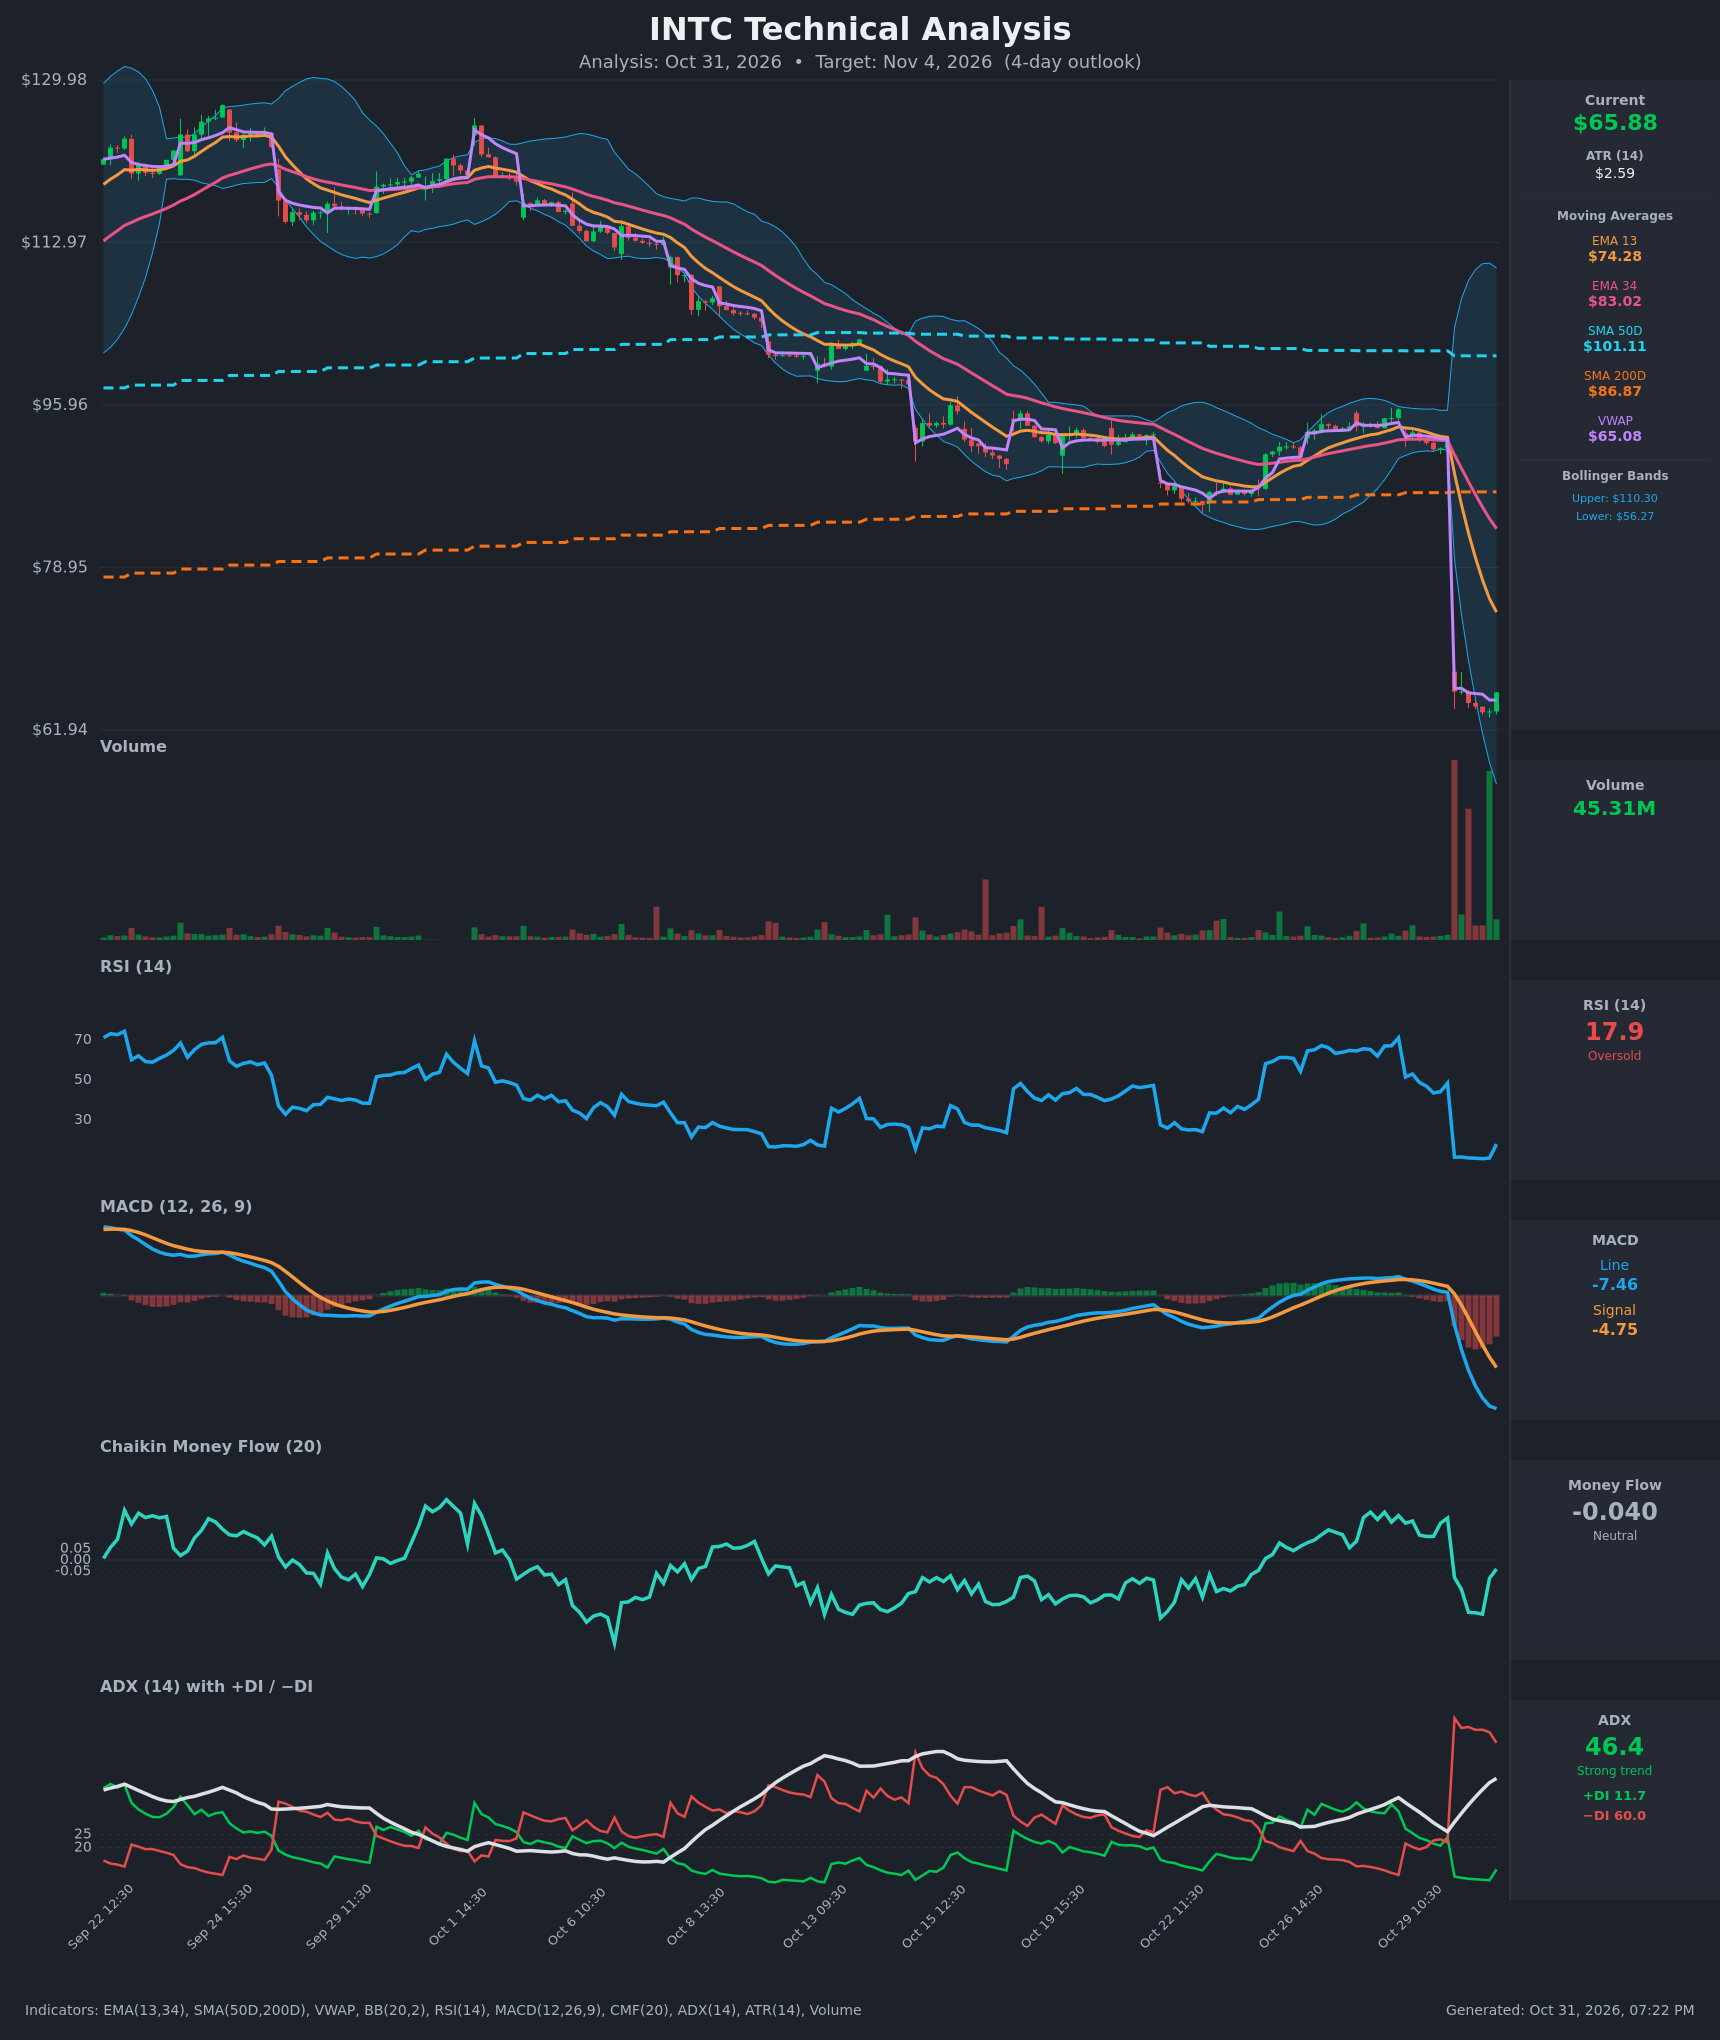
- RSI (14): 17.9, deeply oversold. It bottomed at 10.6 on Oct 30 13:30 and has ticked up to 17.9, the first sign of momentum stabilizing after the gap. It is still far below 30. [Bullish]
- 20 EMA: No 20 EMA is provided, so I use the EMA 13 ($74.28) and EMA 34 ($83.02). Price is well below both, and both are falling steeply. EMA13 is below EMA34, so the bearish alignment is intact, and the EMAs are overhead resistance. [Bearish]
- MACD: The line (-7.46) is below the signal (-4.75), and the histogram is deeply negative and still widening. The bearish crossover happened at the gap, with no sign of a turn yet. [Bearish]
- Bollinger Bands (20): Upper $110.30, lower $56.27, midline about $83.3. The gap blew the bands wide open. Price at $65.88 sits in the lower third, well below the mid-band but about $9.60 above the lower band, so it is not a "band-walk" extreme. A reversion bounce is plausible, but the wide bands signal very high volatility. [Neutral]
- CMF (20): -0.040, in the neutral zone. It has recovered from -0.240 and rose in the last two bars, which suggests selling pressure is easing. [Neutral]
- ADX (14): 46.4 and rising, with -DI at 60.0 far above +DI at 11.7. This is a strong bearish trend, though the ADX reading is inflated by the single gap bar. +DI ticked up from 7.5 to 11.7 and -DI fell from 69.4 to 60.0 on the last bar. [Strong Trend - Bearish]
- Volume: 45.31M on the latest bar, very heavy compared with the prior baseline. The final bar is a green candle on large volume, which may indicate capitulation or dip-buying. Volume was also huge on the initial gap-down bar. [Capitulation / Possible Stabilization]
DIVERGENCES & TRENDS
- Price made a new low at $63.78 (Oct 30 13:30). RSI made its low at the same time (10.6), and the latest bar's rebound to 17.9 is an early bounce rather than a clean divergence.
- MACD is still falling, with no momentum divergence.
- CMF is improving (-0.240 to -0.040) while price was flat to slightly lower. That is a mild bullish money-flow divergence.
- Price is above VWAP ($65.08) for the first time since the gap. VWAP is a post-gap anchor, so this is a short-term positive.
- A death cross has already occurred: SMA50D ($101.11) is above SMA200D ($86.87), but price is far below both. The long-term trend is decisively down.
- The EMA13/EMA34 bearish stack and the gap-down from about $92 to about $66 (-28%) mark a major trend break.
- The gap area ($66 to $92) is a large overhead supply zone.
CHART PATTERNS
- Bearish Pennant / Flag (continuation): The tight, sideways-to-slightly-down consolidation at $63.8 to $66 after a vertical drop resembles a bearish pennant. It has only 7 bars, so it is not mature. A break below $63.78 would project a measured move of roughly $63.78 minus the consolidation range plus further extension, likely toward $60 to $61.
- Reversal hint (early Double Bottom / base): The latest green candle on heavy volume above VWAP is the first sign of a base. It needs a hold above $66.30 to confirm.
- The gap itself is the dominant feature. Gaps this large rarely fill within 4 days, but oversold relief bounces of 3% to 7% are common.
POTENTIAL SCENARIOS
- Scenario 1: Bullish Oversold Relief Bounce — RSI near 18, a heavy-volume green reversal bar, price reclaiming VWAP, and improving CMF favor a mean-reversion bounce. Trigger: a hold above $65.00 and a break over $66.50. Target: $67.50 to $69.00 (about 1 to 1.5 ATR above the current price). Invalidation: a close below $63.78. (47% probability)
- Scenario 2: Bearish Trend Continuation — The post-gap pennant resolves lower, with ADX at 46 and -DI dominant, and the bounce fails below VWAP. Trigger: a break below $63.78 on volume. Target: $60.50 to $62.00. Invalidation: a reclaim of $67.50. (38% probability)
- Scenario 3: Neutral Consolidation — Price chops between $64 and $67 while the market digests the gap. Trigger: low-volume, narrow-range days. Target: $65 to $66.50. Invalidation: a close outside $63.78 to $67.50. (15% probability)
PRICE TARGETS
Timeframe: 4 days (through Nov 4, 2026).
- Target Price: $67.20
- Expected Range: $63.90 to $68.10 (width $4.20, about 6.4% of current price, consistent with the ATR of $2.59 and the elevated post-gap volatility)
- Key Levels: Support at $63.78, Resistance at $69.00
OVERALL BIAS
OVERALL BIAS: BULLISH - Price is deeply oversold (RSI 17.9) and has printed a heavy-volume green reversal bar above VWAP, while CMF is recovering from -0.24. These favor a modest relief bounce toward $67 to $69 within 4 days. Conviction is limited because the trend (ADX 46, -DI 60, MACD widening, price below all MAs) remains strongly bearish, and a break below $63.78 would invalidate the call.
This is educational analysis and not financial advice.