USO 4-day bullish forecast — Oct 31, 2026
- Bias: Bullish
- Timeframe: 4 days (made Oct 31, 2026, target date Nov 3, 2026)
- Price at analysis: $168.82
- Price target: $169.50
- Expected range: $165.00 – $172.50
- Result: Incorrect (-6.2%) — closed at $158.37 on Nov 3, 2026; quality score 0/100
Get a free AI analysis of USO today
Analysis
TECHNICAL INDICATORS
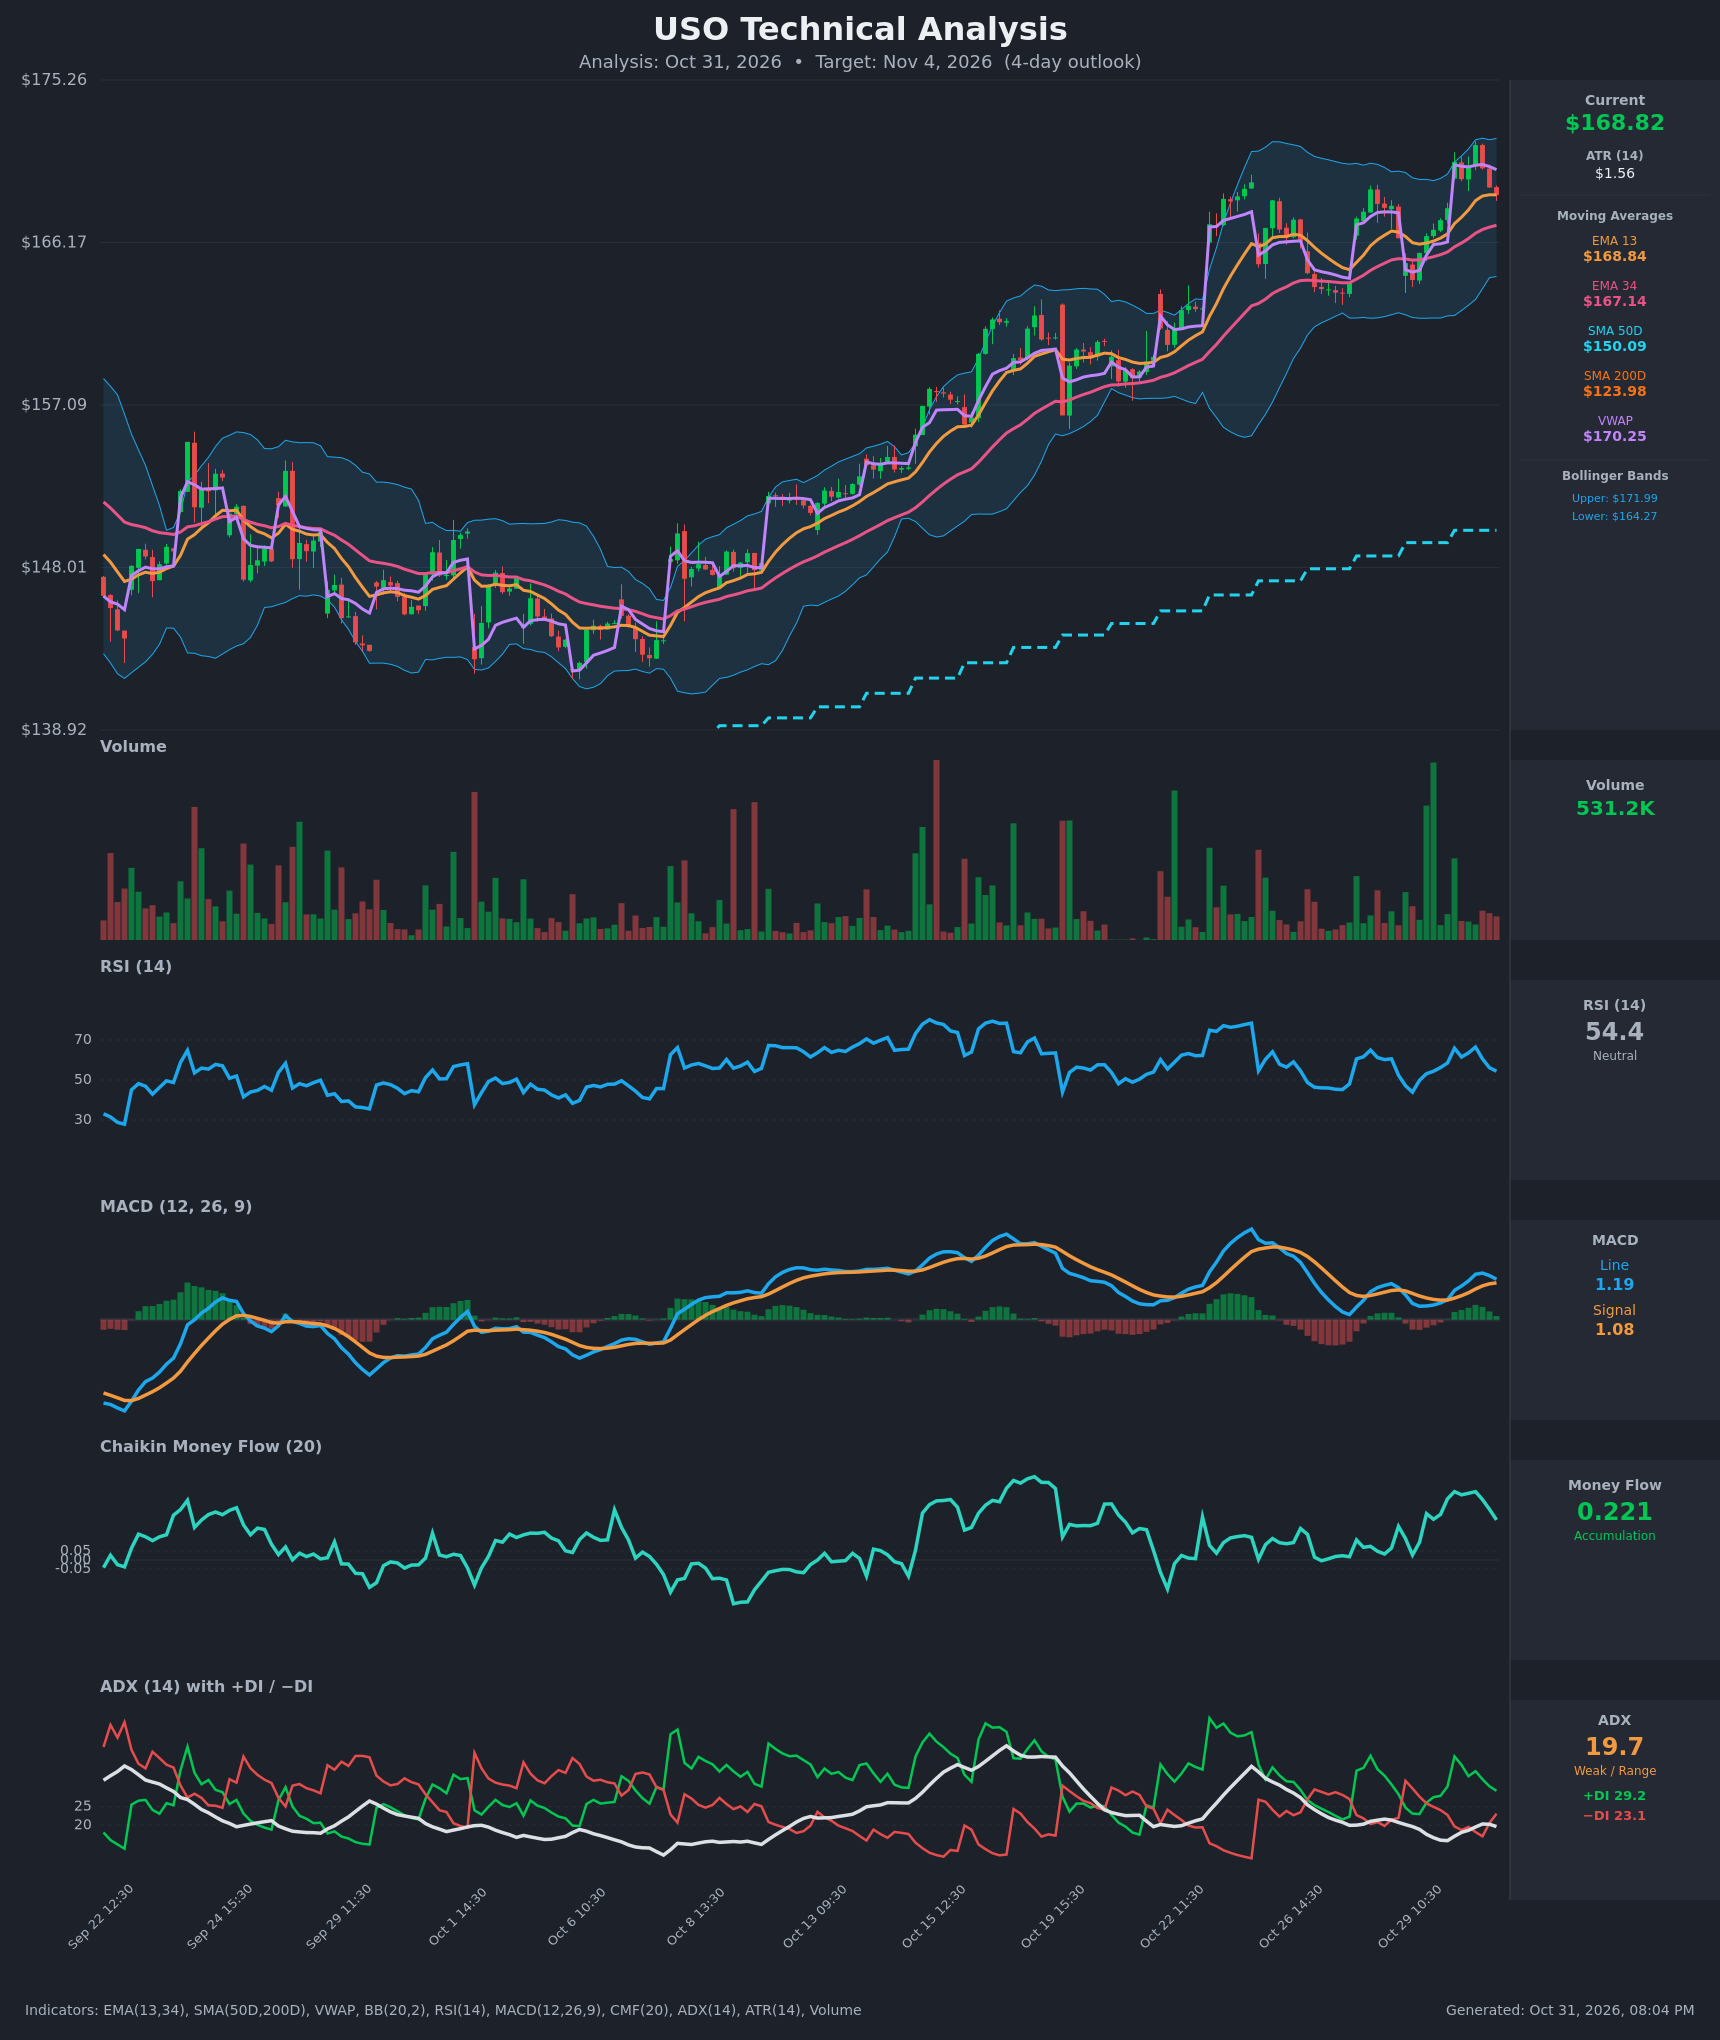
- RSI (14): 54.41, down from a 66.5 peak on Oct 30 midday. Momentum has cooled from near-overbought back toward the midline, but it is still above 50. [Neutral]
- 20 EMA (EMA 13/34 used): EMA13 is $168.84 and price is $168.82, so price sits right on it. EMA34 is $167.14, about 1% below. EMA13 is above EMA34, so the short-term trend is up, but price has lost its pullback momentum and is testing EMA13 as support. [Bullish]
- MACD: Line 1.188 is above signal 1.081, a positive histogram of about +0.11. The histogram is narrowing from its Oct 30 peak (line 1.369 vs signal 0.994), so upside momentum is fading but no bearish cross has occurred. [Bullish]
- Bollinger Bands (20): Upper $171.99, lower $164.27, midline about $168.13. Price is just above the midline after being rejected near the upper band ($171.62 high). The bands are moderately wide, and a mean-reversion pullback to the midline is under way. [Neutral]
- CMF (20): 0.221, well above +0.05, though down from 0.377. Accumulation remains solid despite the pullback. [Accumulation]
- ADX (14): 19.7 with +DI 29.2 over −DI 23.1. The trend is weak and the ADX is flat to slightly falling. The DI spread is narrowing from 38/20 on Oct 30 morning. Bulls are still on top, but with little trend strength. [Weak Trend, Bullish lean]
- Volume: 531.2K, modest and below the large spikes seen in recent sessions. The Oct 30 pullback came on average to light volume, which suggests mild profit-taking rather than aggressive distribution. [Neutral to mildly Bullish]
DIVERGENCES & TRENDS
- Price made a higher intraday high on Oct 30 ($171.62) with RSI at 66.5, but RSI and the MACD histogram have been falling since. This is short-term momentum cooling, not a confirmed divergence.
- The longer-term trend is strongly up. Price is far above SMA50D ($150.09) and SMA200D ($123.98), and the golden cross is long established. The chart shows a steady series of higher highs and higher lows from the early-October low near $140.
- Price is below VWAP ($170.25), which signals intraday sellers in control on the last session. The last five hourly bars were lower, with a pullback from $171.62 to $168.82.
- The DI spread is narrowing, and the MACD line is rolling over toward the signal line. A bearish cross is possible within a few bars if the pullback continues.
- CMF stays positive, which argues the dip is corrective.
CHART PATTERNS
- The chart shows a strong uptrend with the latest sessions consolidating near the upper Bollinger Band. This resembles a Bullish Flag / mild pullback continuation from the reference diagram, with a higher-high rally followed by a shallow, orderly retracement.
- The small rejection at $171–172 over two sessions leaves a possible short-term Bearish Double Top risk. It is not confirmed, because price has not broken below the neckline near $164–165.
- Flag-style target: a break above $171.62 projects toward $174–175 (the top of the chart range). Support zone: EMA34 at $167.14 and the lower band at $164.27.
POTENTIAL SCENARIOS
- Scenario 1: Bullish Trend Continuation — The pullback holds at EMA13/EMA34 ($167–168.8), CMF stays in accumulation, and price resumes toward the upper band. Trigger: reclaim of VWAP ($170.25) and a close above $171.62. Target: $173.50–$175. Invalidation: close below $166.50. (45% probability)
- Scenario 2: Neutral Consolidation — With ADX below 20, price chops between EMA34 and VWAP, roughly $167 to $171, and ends near the current price. Trigger: low volume with no break of either boundary. Target: $168–$170. Invalidation: close outside $166.50–$172. (30% probability)
- Scenario 3: Bearish Deeper Pullback — MACD crosses below signal, +DI and −DI converge, and price loses EMA34. Trigger: break below $167.14 on rising volume. Target: $164.30–$165 (lower band). Invalidation: reclaim of $170.25. (25% probability)
PRICE TARGETS
For a 4-day horizon, the range width should be about 4–8% of price, and the ATR of $1.56 implies roughly ±$3 over 4 days. Range: $165.00 to $172.50 = $7.50 width, about 4.4%. The check passes.
- Target Price: $169.50 (4-day horizon)
- Expected Range: $165.00 to $172.50
- Key Levels: Support at $167.14 (EMA34), Resistance at $171.99 (upper Bollinger Band)
OVERALL BIAS
OVERALL BIAS: BULLISH - The long-term trend is firmly up (price far above SMA50D and SMA200D), CMF shows strong accumulation, MACD remains above signal, and the +DI is above −DI. The pullback appears corrective, so I lean toward a modest upward bias, though conviction is moderate because of the weak ADX and fading momentum.
This is educational analysis and not financial advice.