USO 62-day bearish forecast — Nov 15, 2026
- Bias: Bearish
- Timeframe: 62 days (made Nov 15, 2026, target date Jan 15, 2027)
- Price at analysis: $145.58
- Price target: $137.00
- Expected range: $124.00 – $156.00
- Result: Pending — graded after the close on Jan 15, 2027
Get a free AI analysis of USO today
Analysis
TECHNICAL INDICATORS
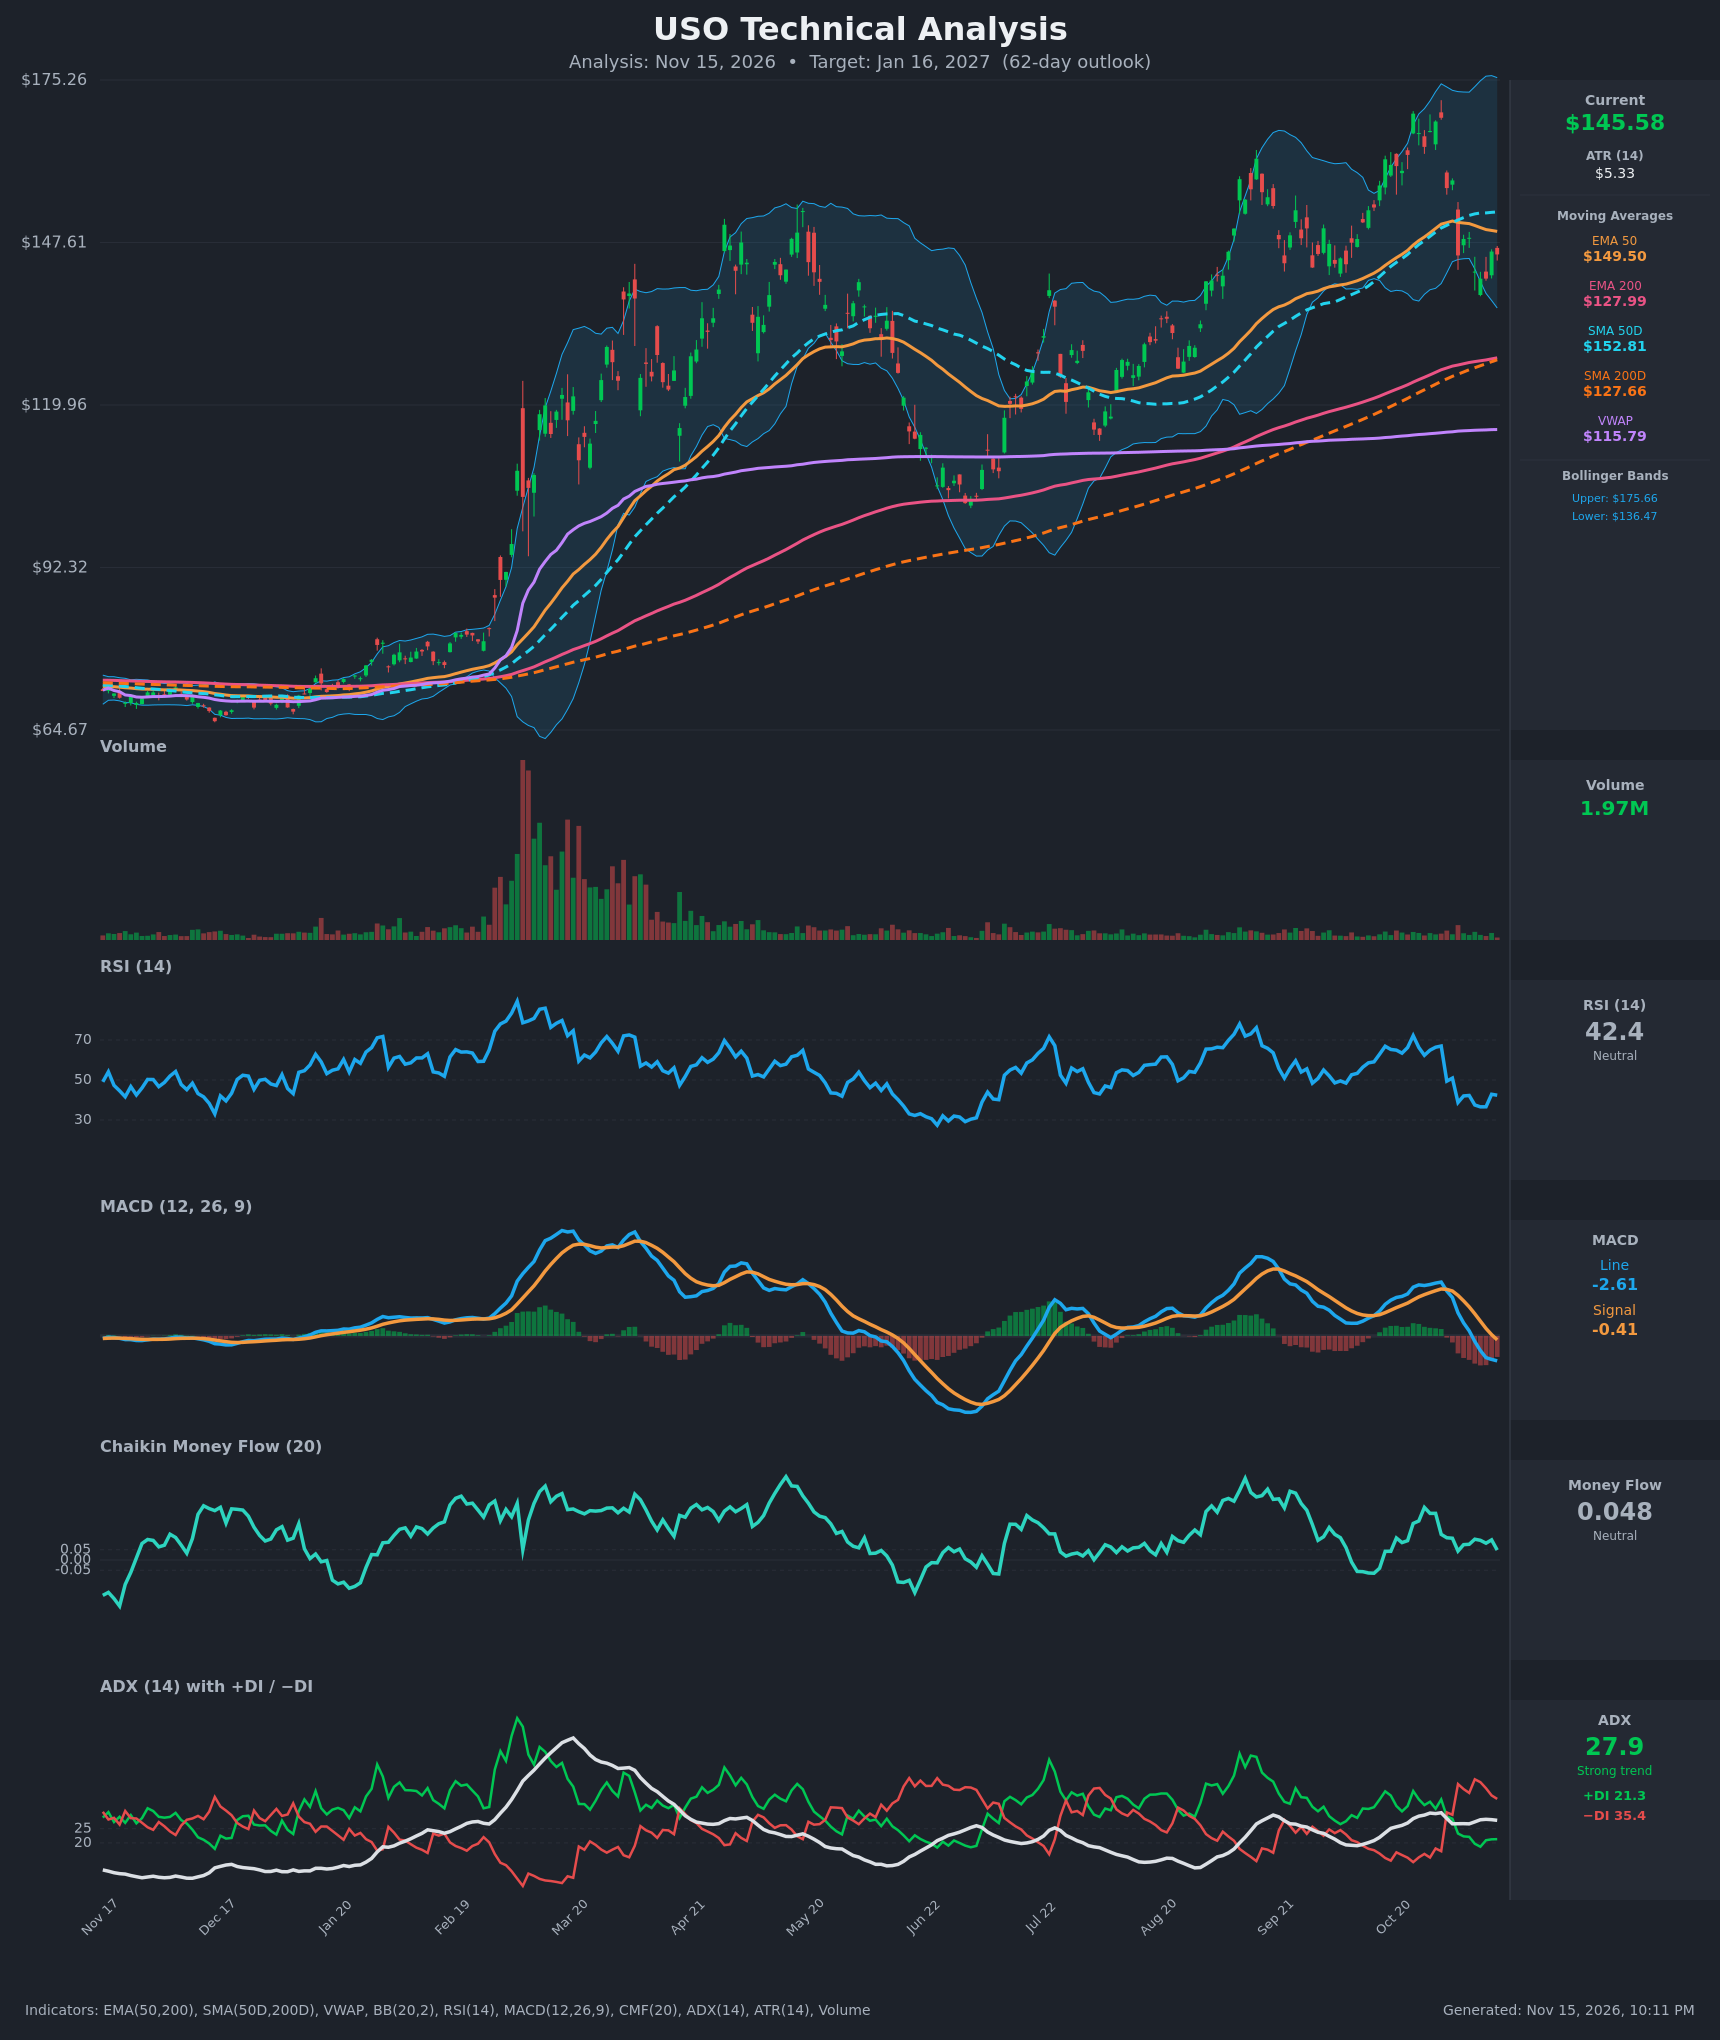
- RSI (14): 42.39, down from 67 on Oct 30 and below the 50 midline. It made a lower low at 36.6 on Nov 10-11 and has only bounced to the low 40s. Momentum is weak but not oversold. [Bearish]
- 20 EMA: No 20 EMA value was supplied. The EMA 50 is $149.50 and price at $145.58 is below it, so it now acts as resistance. The EMA 50 is also sloping down (peaked near $151.26). [Bearish]
- MACD: Line -2.61 is below Signal -0.41, a bearish crossover on Nov 9-12 that has since widened. The histogram is negative and expanding, and the line has dropped below zero. [Bearish]
- Bollinger Bands (20): Upper $175.66, lower $136.47, so price sits in the lower half of the bands, about 7% above the lower band. The bands are wide after the October spike. The sell-off from the upper band to below the midline (about $156) shows momentum has shifted down. [Bearish]
- CMF (20): 0.048, just under the +0.05 accumulation threshold and fading from 0.19-0.25 in late October. Buying pressure is draining but there is no distribution yet. [Neutral]
- ADX (14): 27.9 with −DI 35.4 above +DI 21.3. The trend is strong and the bears are in control. The −DI crossed above +DI on Nov 2 and the gap has widened. [Strong Trend – Bearish]
- Volume: 1.97M, light and in line with the quiet baseline since March. The drop from $168 to $141 came without a volume surge, so selling is orderly rather than panicked. This offers little confirmation either way. [Neutral]
DIVERGENCES & TRENDS
- Bearish momentum trend: MACD and RSI both peaked on Oct 30 and have fallen steadily since. The Nov 4 drop (-$12.76) took price below both the EMA 50 and the SMA 50.
- Moving averages: Price is still above the EMA 200 ($127.99) and SMA 200 ($127.66), so the long-term uptrend is intact. The EMA 50 ($149.50) is above the EMA 200 and the SMA 50 ($152.81) is above the SMA 200, so there is no death cross. The SMA 50 has flattened and is starting to roll over. This is a pullback within a larger uptrend, not yet a reversal.
- VWAP: Price is well above VWAP ($115.79). Longer-term buyers are still in profit, which gives a deep support zone but also room for further mean reversion.
- Divergences: No clear bullish divergence. RSI made a lower low (36.6) while price made a roughly equal low ($141.45), so momentum is not stabilizing.
- Range history: The Oct 30 peak ($168.83) was a failed extension, and price has since lost the EMA 50 and SMA 50.
CHART PATTERNS
- Bearish Double Top / failed breakout (loose match): Price spiked to $166-169 in late October, was rejected sharply, and has fallen below the prior consolidation zone ($150-155). The spike-and-reversal behaves like a bearish reversal on a larger scale. The measured move points toward the EMA 200 / SMA 200 region near $128.
- Bearish flag (minor): The small bounce from $141.45 to $146.07 on declining participation resembles a bearish flag or pennant in the diagram. A break below $141.45 would project toward $130-135.
- Counterpoint: The broader uptrend since February resembles a long ascending channel. As long as price holds above the 200-period averages (~$128), the bullish structure is not broken.
POTENTIAL SCENARIOS
- Scenario 1: Bearish Pullback to the 200-Day Zone — Price loses the $141.45 swing low and the lower Bollinger Band ($136.47), with MACD staying negative and −DI dominant. Price drifts toward the rising EMA 200 / SMA 200 near $128-132, then stabilizes. Trigger: daily close below $141.45. Target: $130-137. Invalidation: close above $152.81 (SMA 50). (50% probability)
- Scenario 2: Bullish Recovery and Trend Resumption — The lower band and rising 200-day averages attract buyers, price reclaims the EMA 50 and SMA 50, and MACD re-crosses up. A retest of the October highs follows. Trigger: close above $152.81 with CMF above +0.05. Target: $160-168. Invalidation: close below $136.47. (28% probability)
- Scenario 3: Neutral Range Consolidation — Price chops between $136 and $152 as ADX fades and the averages converge. Trigger: ADX falling below 25 with price holding $138-150. Target: $142-148. Invalidation: close outside $136-153. (22% probability)
PRICE TARGETS
- Target Price: $137.00 (62-day, Jan 16, 2027)
- Expected Range: $124.00 to $156.00 (width $32 = about 22% of current price, consistent with the 61-180 day guidance)
- Key Levels: Support at $141.45, Resistance at $149.50
OVERALL BIAS
OVERALL BIAS: BEARISH - Price has lost the EMA 50 and SMA 50, MACD has crossed bearishly below zero, and ADX at 27.9 with −DI far above +DI shows a strong downtrend. The most likely path is a pullback toward the 200-day averages near $128-135, though the long-term uptrend above them limits the downside.
This is educational analysis and not financial advice.