USO 34-day bearish forecast — Nov 15, 2026
- Bias: Bearish
- Timeframe: 34 days (made Nov 15, 2026, target date Dec 18, 2026)
- Price at analysis: $145.58
- Price target: $138.50
- Expected range: $129.50 – $151.50
- Result: Pending — graded after the close on Dec 18, 2026
Get a free AI analysis of USO today
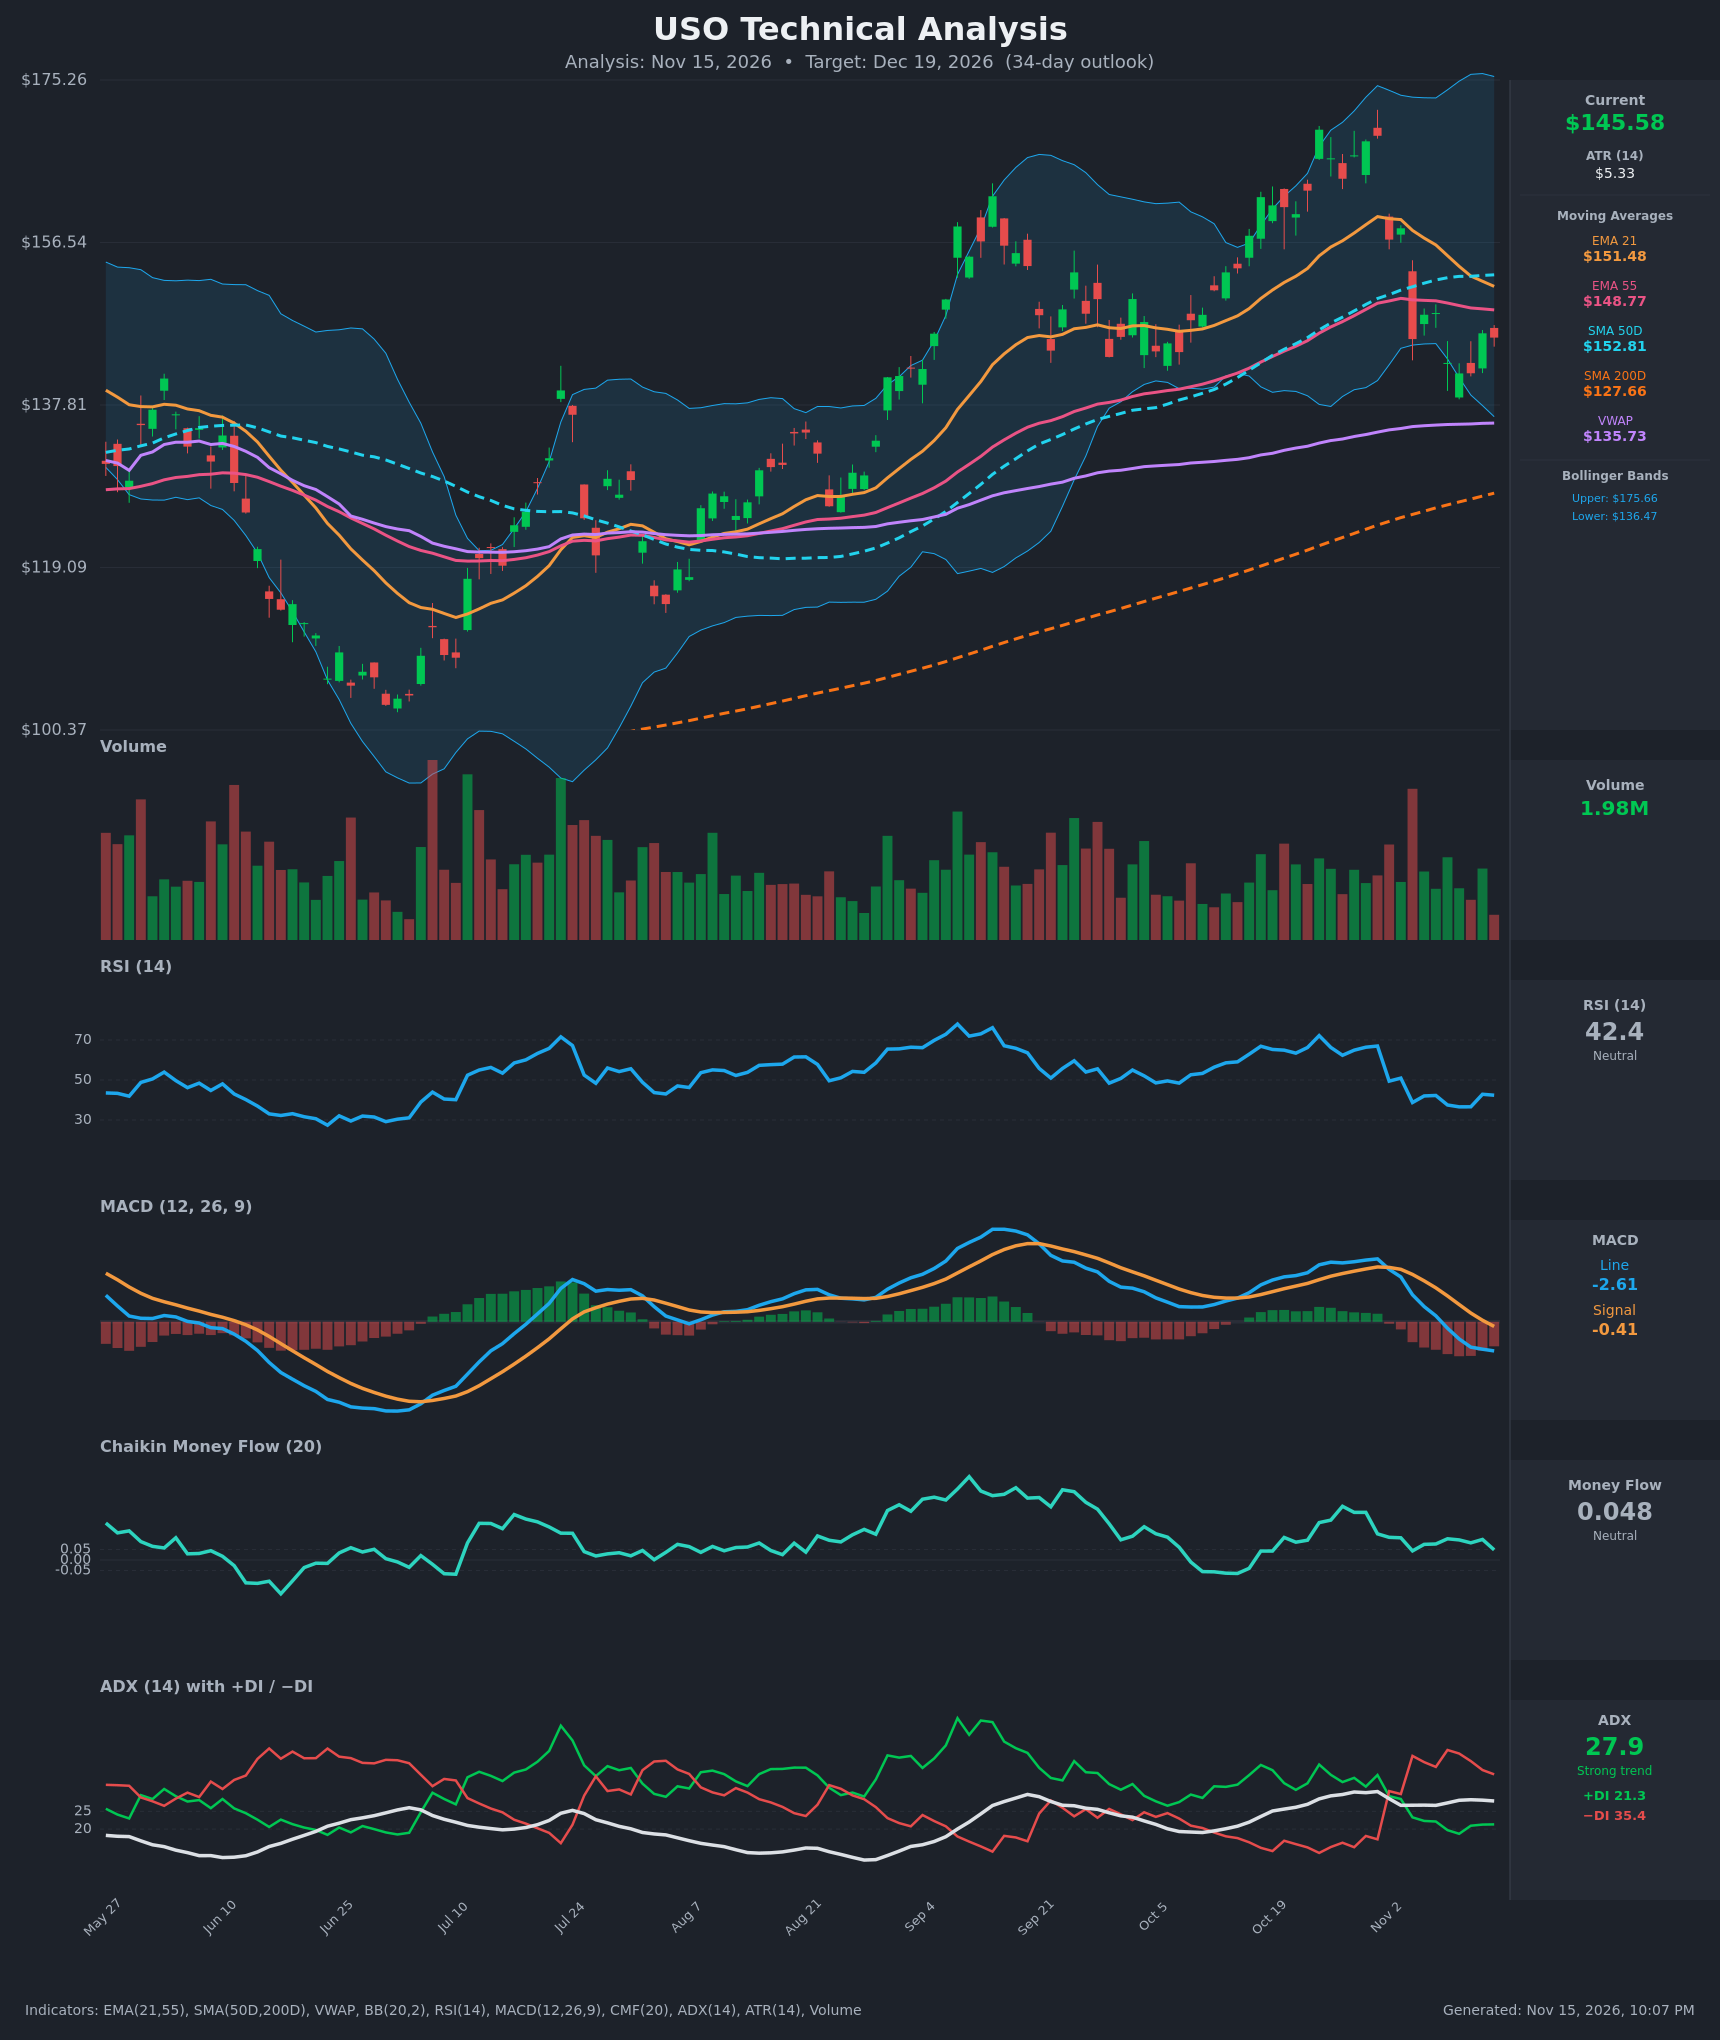
Analysis
TECHNICAL INDICATORS
- RSI (14): 42.39, below the 50 midline and well off the ~67 reached on Oct 30. It has stayed in the 36–43 range since Nov 9 with no overbought or oversold extreme. A small bounce from 36.6 has stalled. [Bearish]
- 20 EMA (EMA 21): $151.48 and falling steeply. Price at $145.58 is below it, so it acts as overhead resistance. The EMA 55 at $148.77 also sits above price. [Bearish]
- MACD: Line -2.61 against signal -0.41. The bearish crossover happened around Nov 9 and the line is now below zero. The histogram is negative and still widening, so downside momentum is intact. [Bearish]
- Bollinger Bands (20): Upper $175.66, lower $136.47, so the bands are very wide after the rally to ~$169. Price is in the lower half of the bands, below the midline (~$156), and about $9 above the lower band. The wide bands reflect high volatility, and a pullback toward the lower band is plausible. [Bearish]
- CMF (20): 0.048, just under the +0.05 accumulation threshold. It has faded from 0.25 in late October, so buying pressure is fading but there is no outright distribution. [Neutral]
- ADX (14): 27.9 with −DI (35.4) well above +DI (21.3). This is a strong trend, and the bears are in control. The DI crossover to bearish occurred on Nov 2, and the −DI/+DI gap has stayed wide. [Strong Trend – Bearish]
- Volume: 1.98M, average to below average on the recent bounce. The largest recent bar was the heavy red candle on Nov 4. The rebound is on light participation, so there is little conviction behind the bounce. [Mildly Bearish]
Other moving averages and VWAP:
- SMA 50D: $152.81 (resistance). The EMA 21 has crossed below it and is converging on the EMA 55.
- SMA 200D: $127.66, rising, with price well above it. The long-term trend is still up, and this is the main bullish offset.
- VWAP: $135.73, well below price.
DIVERGENCES & TRENDS
- There is no clear bullish divergence. The Nov 12–13 bounce to ~$146 came with a lower RSI/MACD, and RSI has not made a higher low versus the 36.6 reading.
- Price made a higher high near $169–170 in late October while RSI peaked near 67, below the ~76 reached in early September. That is a mild bearish momentum divergence on the rally top.
- MACD has crossed below its signal and below zero. The EMA 21 is rolling over toward the EMA 55, and a bearish EMA 21/55 cross is likely within days if price stays below $148.
- −DI is rising above +DI with ADX at 27.9, which confirms a downtrend phase within the larger uptrend.
- A golden cross is already in place (SMA50 above SMA200), and price remains above the SMA200. This is the pullback within a bullish long-term structure, not a confirmed reversal.
- CMF is fading from the peak but is still slightly positive, so smart-money selling has not yet taken hold.
CHART PATTERNS
- Loose Bearish Double Top (reversal): Highs near $162 in September and $169–170 in late October, with a neckline near the $141 swing lows. A close below $141.45 would activate it. The full measured move is far too large for 34 days, but a partial move to the $135–137 area (lower Bollinger band and VWAP zone) is reasonable.
- Bearish Flag/Pennant (continuation): The bounce from $141.45 to ~$146 under falling EMAs resembles a small bearish flag after the sharp Nov 4 drop. A break below ~$141 would target roughly $135 and below.
- Counter-view: Price is holding above the rising SMA200 and has formed a higher-low structure since July. A recovery above $152 (EMA 21/SMA 50 cluster) would negate the bearish patterns.
POTENTIAL SCENARIOS
- Scenario 1: Bearish Pullback to Band/VWAP Support — Sellers keep control (−DI dominant, MACD below signal). Price fails at the EMA 55/EMA 21 and breaks the $141.45 swing low, then drifts toward the lower Bollinger band and VWAP. Trigger: daily close below $141.45. Target: $135–$138. Invalidation: daily close above $152.80 (SMA 50). (50% probability)
- Scenario 2: Bullish Rebound and Trend Resumption — Dip buyers defend the $136–141 zone with the SMA200 rising underneath. Price reclaims the EMA 21 and SMA 50, and CMF turns back above +0.05. Trigger: close above $152.80 with rising volume. Target: $158–$162. Invalidation: close below $136.50. (28% probability)
- Scenario 3: Neutral Range Chop — Price oscillates between the $138 support area and the $150 EMA resistance as ADX cools. Trigger: failure to break either $141.45 or $151.48 for several weeks. Target: $142–$149. Invalidation: close outside $136–$153. (22% probability)
PRICE TARGETS
- Target Price: $138.50 (34-day, Dec 19 outlook)
- Expected Range: $129.50 to $151.50 (width $22.00 ≈ 15.1% of current price, consistent with the 30–60 day guidance of 12–18%)
- Key Levels: Support at $141.45 (recent swing low, then the $136.47 lower Bollinger band), Resistance at $151.48 (EMA 21, with the SMA 50 just above at $152.81)
OVERALL BIAS
OVERALL BIAS: BEARISH - Price is below the EMA 21, EMA 55 and SMA 50. MACD has crossed bearishly below zero, and −DI is well above +DI with ADX at 27.9. The rebound is on light volume, which favors a retest of the $136–139 area, but the rising SMA200 and a still-positive CMF limit the downside.
This is educational analysis and not financial advice.