USO 27-day bearish forecast — Nov 15, 2026
- Bias: Bearish
- Timeframe: 27 days (made Nov 15, 2026, target date Dec 11, 2026)
- Price at analysis: $145.58
- Price target: $140.50
- Expected range: $130.00 – $151.50
- Result: Pending — graded after the close on Dec 11, 2026
Get a free AI analysis of USO today
Analysis
TECHNICAL INDICATORS
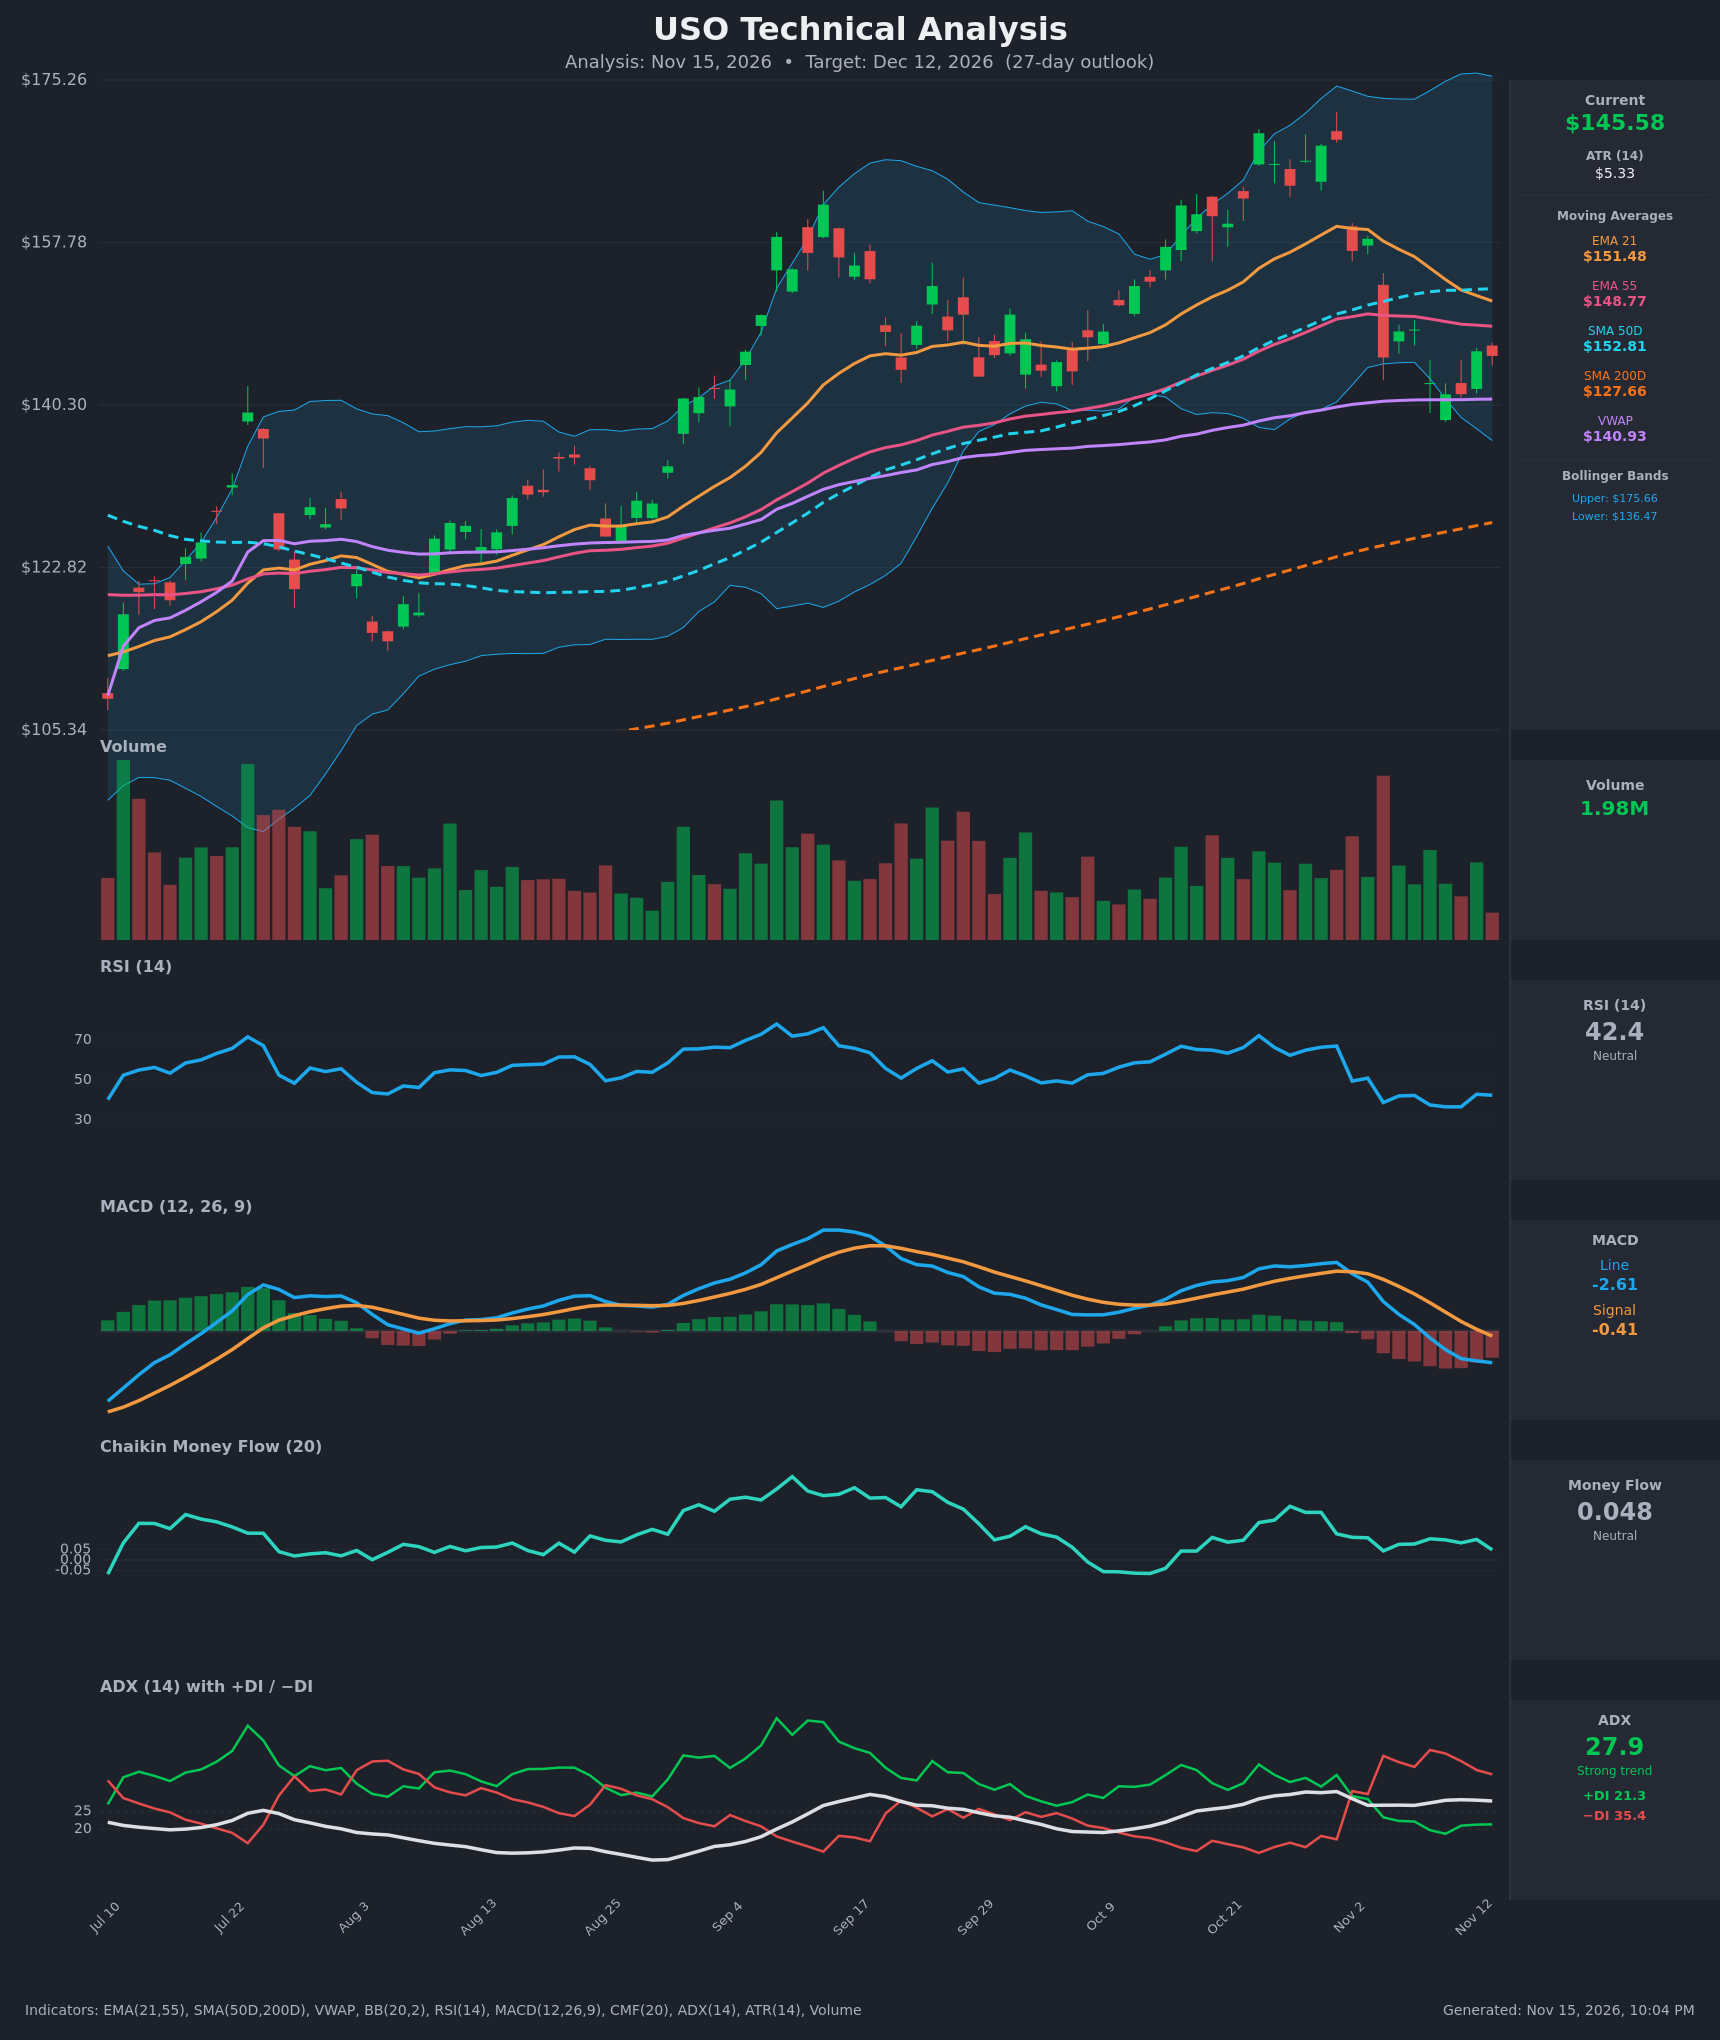
- RSI (14): 42.39, below the 50 midline and recovering slightly from 36.6 on Nov 10-11. It has not reached oversold and is still well off the 67 reading of Oct 30, so momentum favors sellers. [Bearish]
- 20 EMA: The EMA 21 is $151.48 and falling steadily from $159.52. Price at $145.58 is below it, so it acts as overhead resistance. Price is also below the EMA 55 ($148.77) and SMA50D ($152.81). EMA21 is nearing a bearish cross of EMA55 (gap of only $2.70 and closing). [Bearish]
- MACD: The line is -2.61 and the signal is -0.41. The line crossed below the signal around Nov 2-3 and below zero on Nov 9. The histogram is negative and still widening, so downside momentum has not yet turned. [Bearish]
- Bollinger Bands (20): The bands run $136.47 to $175.66, very wide after the October spike. Price sits in the lower third, below the midline (about $156), and about $9 above the lower band. The band is not yet breached, so there is room for a test of $136-137. [Bearish]
- CMF (20): 0.048, just under the +0.05 accumulation threshold and fading from 0.10. Buying pressure is marginal and weakening. It is not distribution, but it does not support a strong rebound either. [Neutral]
- ADX (14): 27.9 with −DI (35.4) well above +DI (21.3). The trend is strong and bears control it. ADX has been flat to slightly down from its 30.6 peak, so the downtrend is mature but intact. [Strong Trend – Bearish]
- Volume: The latest bar is 1.98M and low, a small red bar. The heaviest recent volume was on the Nov 4 breakdown candle, and the Nov 12 bounce came on modest volume. That suggests a weak relief bounce rather than aggressive buying. [Mildly Bearish]
DIVERGENCES & TRENDS
- No clear divergence. RSI (36.6 → 42.4) and price (141.45 → 145.58) are rising together in the bounce, but MACD's histogram is still deepening, so there is no confirmed bullish divergence.
- The MACD bearish crossover (early Nov) and its drop below zero confirm the momentum shift from the Oct 30 peak at $168.83.
- The DI crossover on Nov 2 (−DI above +DI) has widened into a 14-point spread.
- Price is below EMA21, EMA55 and SMA50D. EMA21 is approaching EMA55 from above, a possible bearish crossover.
- The long-term structure is still constructive. Price is well above the rising SMA200D ($127.66), and SMA50D ($152.81) is above SMA200D with no death cross.
- Price is above VWAP ($140.93), which has held as support on the recent pullbacks.
CHART PATTERNS
- Bearish Flag / Pennant (continuation): After the sharp drop from $168.83 to $141.45, the bounce to $146-148 is a small, low-volume counter-trend rally. It resembles the Bearish Flag, and a break below $141 would project a measured move toward $130-135.
- Bullish Double Bottom (minor, reversal): The closes at $141.45 and $141.47 on Nov 10-11 form a small double bottom with a neckline near $148.4-148.8. A close above that level, which is also the EMA55, would target about $155. This pattern is not yet confirmed.
- The broader picture is a failed advance from the $140-ish base. Price is now in a lower-high, lower-low sequence from the $168.83 peak.
POTENTIAL SCENARIOS
- Scenario 1: Bearish Flag Breakdown — The bounce fades at EMA55/EMA21 and price breaks the $141 base (VWAP and the double-bottom lows). MACD stays negative and −DI dominates. Trigger: daily close below $141.00. Target: $136.50 (lower Bollinger Band), extending to $130-132 near the 1.5x ATR extension. Invalidation: daily close above $151.50 (EMA21). (50% probability)
- Scenario 2: Bullish Double-Bottom Rebound — Buyers defend VWAP and $141, CMF stays positive and price reclaims the EMAs. Trigger: close above $148.80 (EMA55 and neckline) with rising volume. Target: $152-153 (EMA21/SMA50D), then $156. Invalidation: close below $141.00. (30% probability)
- Scenario 3: Neutral Range Consolidation — Price chops between $141 and $149 as the moving averages converge on it. Trigger: failure to break either $141 or $148.80 for several weeks. Target: $143-147. Invalidation: close outside the $140-$150 band. (20% probability)
PRICE TARGETS
- Target Price: $140.50 (27-day, Dec 12, 2026)
- Expected Range: $130.00 to $151.50. The width is $21.50, about 14.8% of the current price, which fits the 12-18% guide for 30-60 days and is scaled slightly down for 27 days.
- Key Levels: Support at $140.93 (VWAP, with the $141.45 swing low just below), Resistance at $148.77 (EMA55)
OVERALL BIAS
OVERALL BIAS: BEARISH - Price is below the EMA21, EMA55 and SMA50D with a bearish MACD cross below zero, and −DI (35.4) is far above +DI (21.3) with ADX at 27.9. The bounce has come on light volume and RSI is below 50. The rising SMA200D and the VWAP/$141 support limit the downside, so the target is a retest of the $140 area with a risk of a deeper move toward $130-136.
This is educational analysis and not financial advice.