USO 7-day bullish forecast — Oct 31, 2026
- Bias: Bullish
- Timeframe: 7 days (made Oct 31, 2026, target date Nov 6, 2026)
- Price at analysis: $168.82
- Price target: $170.60
- Expected range: $165.40 – $174.60
- Result: Incorrect (-12.1%) — closed at $148.41 on Nov 6, 2026; quality score 0/100
Get a free AI analysis of USO today
Analysis
TECHNICAL INDICATORS
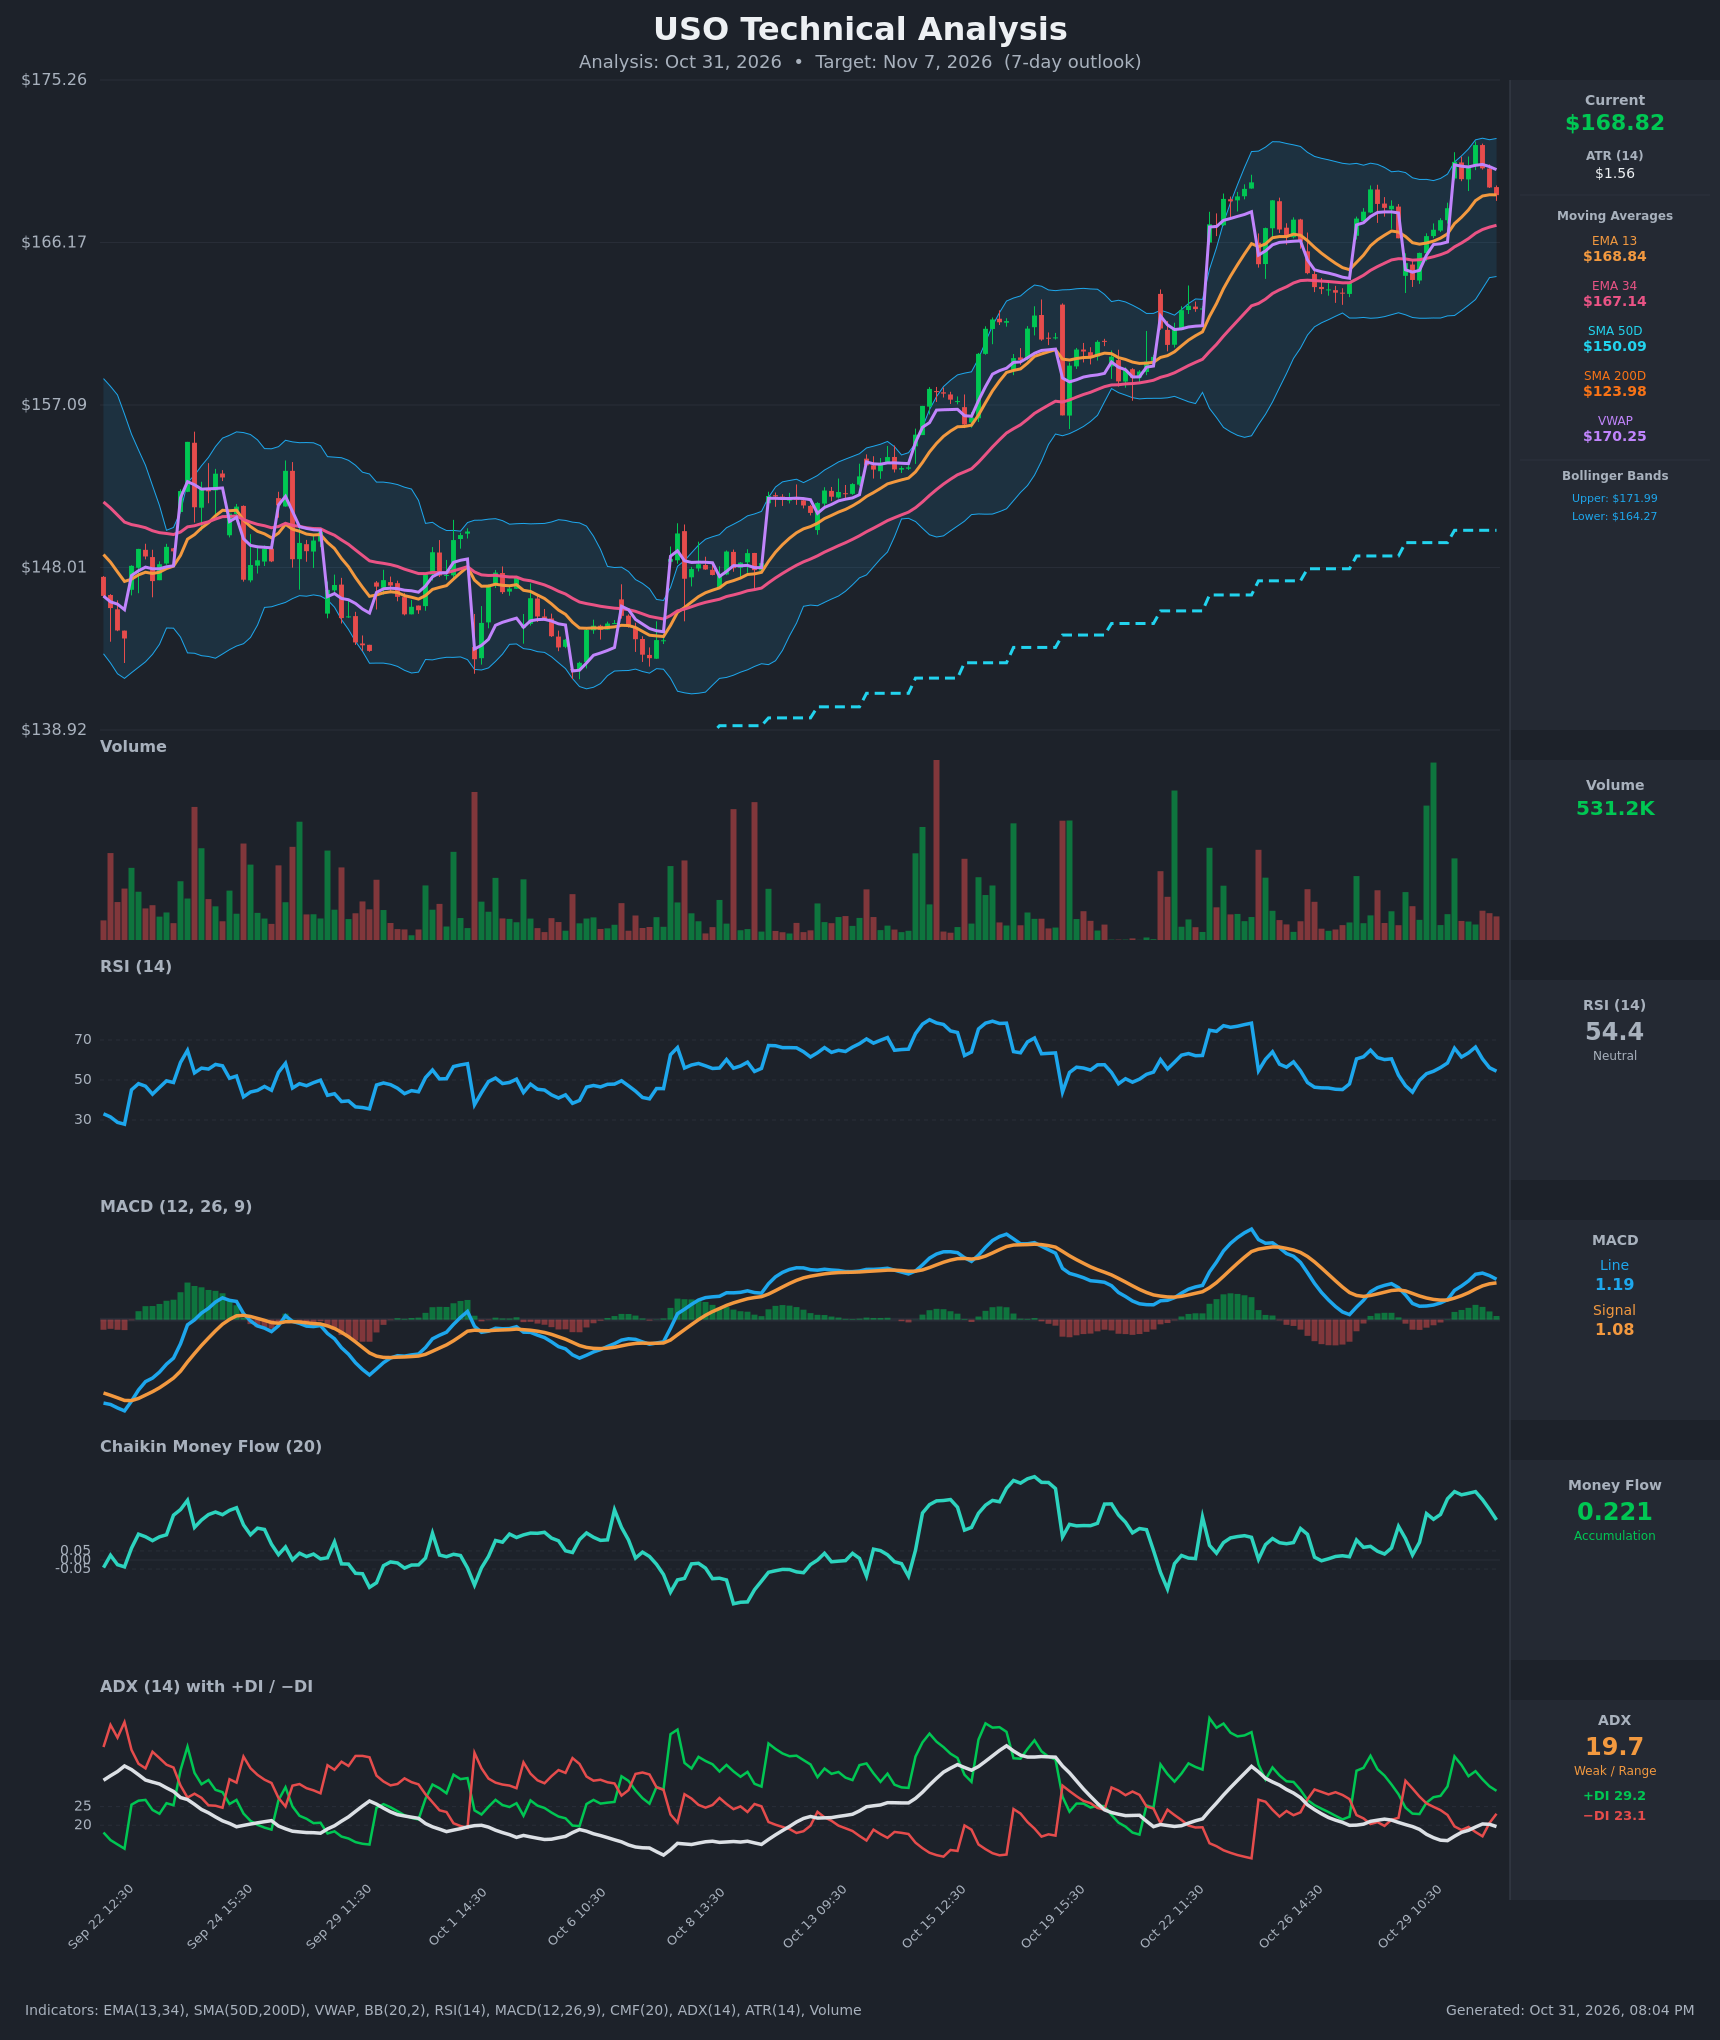
- RSI (14): 54.41, down from 66.5 at the Oct 30 12:30 bar. It is back near the neutral 50 line, so momentum has cooled, but it has not broken below 50 and is nowhere near oversold. [Neutral]
- 20 EMA: The data gives EMA 13 at $168.84 and EMA 34 at $167.14. Price ($168.82) is sitting right on the EMA 13, and EMA 13 is above EMA 34, so the short-term trend is still up. The EMA 34 at $167.14 is the next dynamic support. [Bullish]
- MACD: Line 1.188 is above signal 1.081, so the histogram is still positive at about +0.107. It has shrunk from about +0.375 at the peak (1.369 vs 0.994) and the two lines are converging. The bullish crossover is still intact, but a bearish crossover is possible if the pullback continues. [Neutral]
- Bollinger Bands (20): Upper $171.99, lower $164.27, midline about $168.13. Price touched the upper band area on Oct 30 and has pulled back to the midline. That is a normal reset within an uptrend, and the bands are wide enough to allow movement either way. [Neutral]
- CMF (20): 0.221, well above +0.05 and positive across the whole recent window (0.03 to 0.38). It is off its 0.377 peak but still shows sustained buying pressure. [Accumulation]
- ADX (14): 19.7 with +DI 29.2 above −DI 23.1. Bulls lead, but ADX is below 20, so the trend is not strong. The spread has narrowed from 38.4/19.7 at the Oct 30 open, which fits a pause or consolidation. [Weak Trend, Bullish lean]
- Volume: 531.2K, which looks average to below average on the pullback bars. The larger volume spikes came on the up-moves, so the pullback is not being sold aggressively. [Neutral to mildly Bullish]
Other levels and relationships:
- VWAP: Price is below VWAP at $170.25, which is mild short-term resistance. [Mildly Bearish]
- SMA50D / SMA200D: SMA50D is $150.09 and SMA200D is $123.98. Price is far above both and the golden cross is long established, so the long-term trend is up. The distance from the 50D suggests the move is extended. [Bullish]
DIVERGENCES & TRENDS
- Short-term momentum fade: Price is down about $2.80 from the $171.62 high over 3 bars. RSI fell from 66.5 to 54.4 and the MACD histogram is shrinking. This is short-term loss of momentum, not a classic divergence.
- No major divergence: Price made higher highs through late October, and RSI and MACD are not showing a clear lower-high pattern against them. MACD peaked around Oct 22–23 and again lower on Oct 30, a mild hint of waning momentum on the larger swing.
- Crossovers: The MACD bullish crossover (Oct 29 afternoon) is holding. The +DI/−DI bullish crossover on Oct 29 12:30 is holding but the spread is narrowing. Price is on the EMA 13 and has just slipped under VWAP.
- Trend structure: The sequence of higher highs and higher lows since the Oct 6–8 base is intact. The higher low to defend is around $164–165 (Oct 29 lows).
CHART PATTERNS
- Bullish Flag / Pennant (continuation): After the sharp Oct 30 gap up, price is consolidating in a shallow downward-sloping range just below $171.62. If it breaks higher, the measured move points toward the $173–175 area, in line with the chart's top at $175.26.
- Minor Double Top risk (reversal): Highs near $170.68 and $171.62 on Oct 30 look like a small double top. A break below the intervening low (about $168.8–169) would target roughly $166–167. This is a low-quality pattern on short-term bars, and the nearby EMA 34 at $167.14 and the uptrend structure argue against over-weighting it.
- Overall: The uptrend remains the dominant pattern. The pullback so far looks corrective rather than a reversal.
POTENTIAL SCENARIOS
- Scenario 1: Bullish Flag Breakout / Trend Continuation — The pullback holds at the EMA 34 or midline, and price reclaims VWAP and pushes back to the upper band. CMF stays above 0.15 and +DI stays above −DI. Trigger: hourly close above $170.25 (VWAP), then above $171.62. Target: $172.00–$174.00. Invalidation: close below $166.50. (50% probability)
- Scenario 2: Bearish Deeper Pullback — Momentum keeps fading, MACD crosses below signal, and price loses the EMA 34. It then tests the lower Bollinger Band area and the Oct 29 lows. Trigger: close below $167.14 with MACD bearish cross. Target: $164.30–$165.50. Invalidation: reclaim of $170.25. (33% probability)
- Scenario 3: Neutral Range Consolidation — Weak ADX keeps price chopping between the EMA 34 and the upper band with no resolution. Trigger: ADX stays below 20 and price stays between $167 and $171. Target: $168–$170. Invalidation: close outside $166.50–$172.00. (17% probability)
PRICE TARGETS
Timeframe: 7 days (to Nov 7, 2026).
- Target Price: $170.60
- Expected Range: $165.40 to $174.60 (width $9.20, about 5.4% of the current price, within the 4–8% guide for 7 days)
- Key Levels: Support at $167.14 (EMA 34), Resistance at $171.99 (upper Bollinger Band, just above the $171.62 swing high)
OVERALL BIAS
OVERALL BIAS: BULLISH - Price is above all key moving averages with +DI over −DI, a positive MACD crossover and strong CMF accumulation (0.221), and the pullback is holding near the EMA 13 and midline. Conviction is modest: ADX is weak, RSI and MACD momentum are fading, and price sits just below VWAP, so a retest of the $167 area is likely before any push toward $171–$174.
This is educational analysis and not financial advice.