ASTS 6-day bearish forecast — Nov 1, 2026
- Bias: Bearish
- Timeframe: 6 days (made Nov 1, 2026, target date Nov 6, 2026)
- Price at analysis: $40.99
- Price target: $40.15
- Expected range: $38.90 – $41.70
- Result: Correct (-20.9%) — closed at $32.43 on Nov 6, 2026; quality score 50/100
Get a free AI analysis of ASTS today
Analysis
TECHNICAL INDICATORS
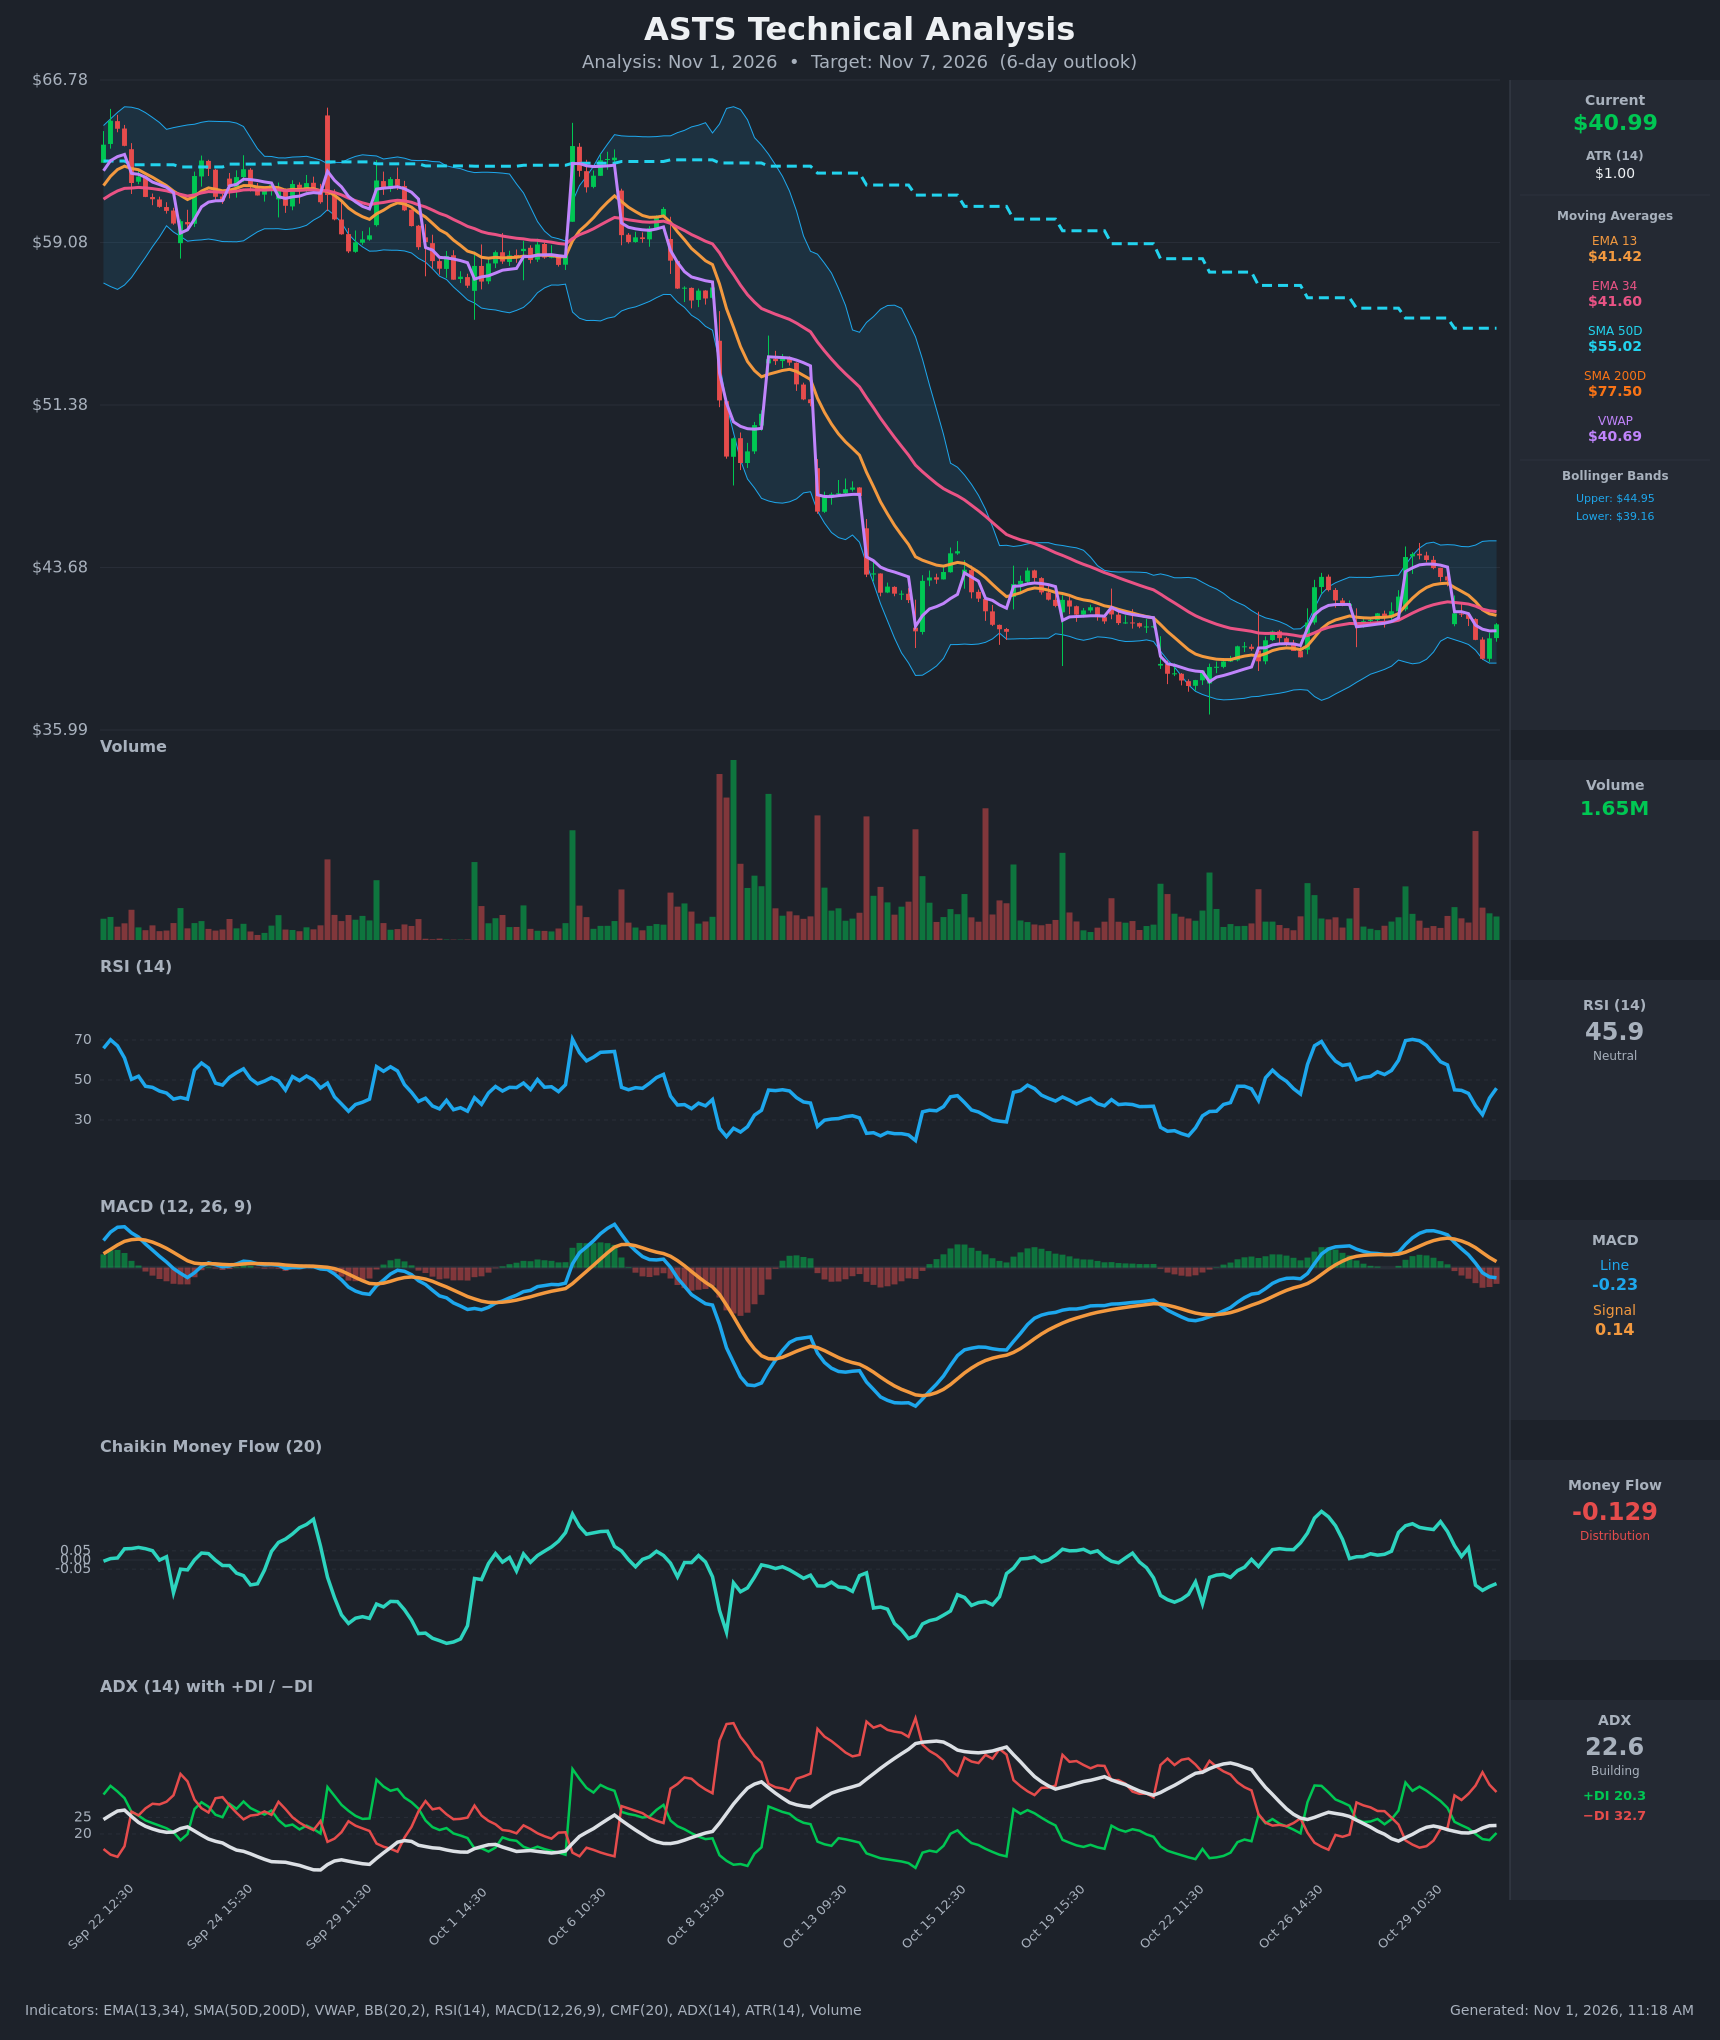
- RSI (14): 45.89. It fell to about 32.7 on Oct 30 at 13:30 and has bounced to the mid-40s. It is below 50 and sits in the lower half of its range, so momentum is soft even though the bounce is real. [Neutral]
- 20 EMA: The chart provides EMA 13 ($41.42) and EMA 34 ($41.60) instead. Price at $40.99 is below both. EMA13 has just crossed below EMA34 (Oct 30 13:30), and both are now overhead resistance around $41.4-$41.6. [Bearish]
- MACD: Line -0.233 is below signal +0.140. The bearish crossover happened on Oct 30 around 13:30, the histogram is negative and expanding, and the line has just dipped below zero. [Bearish]
- Bollinger Bands (20): Upper $44.95, lower $39.16, midline about $42.05. Price is in the lower third of the bands, about $1.83 above the lower band. The bands are fairly narrow after the contraction, and the Oct 30 low at $39.36 stopped just short of the lower band. Price is below the midline, which acts as resistance. [Bearish]
- CMF (20): -0.129, below the -0.05 threshold. It has gone from +0.21 on Oct 29 to negative within a day, which marks a clear shift to distribution. [Distribution]
- ADX (14): 22.6, with −DI (32.7) well above +DI (20.3). The trend is moderate and only just rising out of the weak zone. Bears control direction, and −DI crossed back above +DI on Oct 30 at 09:30. [Moderate Trend, Bearish]
- Volume: 1.65M, near average, with no capitulation spike on the recent bounce. Selling on Oct 30 had decent participation, and the bounce bar is unremarkable. Price is slightly above VWAP ($40.69), a small positive for intraday buyers. [Neutral to Slightly Bearish]
DIVERGENCES & TRENDS
- Long-term trend: Price is far below SMA50D ($55.02) and SMA200D ($77.50). The death cross is already in place, so the long-term trend is firmly bearish.
- Momentum reversal: Oct 29 featured a spike to about $44.3 with RSI near 70 and MACD rising. That rally failed within hours, and price retraced the whole move on Oct 30. This is a bearish momentum failure.
- Crossovers: EMA13 crossed below EMA34, MACD crossed below signal, and −DI crossed above +DI. All three are bearish and happened within the same session.
- Divergence: No clear divergence. RSI is bouncing from 32.7 while price made a higher low versus the $39.36 bar, but this is minor and not confirmed by CMF or MACD.
- CMF: It flipped from accumulation to distribution quickly, which confirms the failed rally.
CHART PATTERNS
- Bearish Double Top (reversal/continuation): Price has made two peaks near $44.3-$44.5 (Oct 15 and Oct 29). The neckline sits around $38.5-$39.4, near the recent lows. A decisive close below it would give a measured target of roughly $33 (height about $5.5-$6). Over 6 days, only partial progress is realistic.
- Range base after a steep decline: The $38-$44.5 consolidation follows a drop from about $63. This is a bearish rectangle or flag-like structure within the larger downtrend. Within that range, the lower Bollinger Band and the Oct 22 lows (about $37.7-$38.5) are the key support area.
- Short-term bounce: The rebound from $39.36 resembles a small bounce into EMA resistance. It has not broken the sequence of lower highs from the Oct 29 peak.
POTENTIAL SCENARIOS
- Scenario 1: Bearish Rejection at EMA Resistance — Price stalls under the EMA13/EMA34 cluster at $41.4-$41.6, then rolls over as MACD, DI and CMF all point lower. Trigger: failure to reclaim $41.60, then a break below $40.40. Target: $39.16-$39.40 (lower Bollinger Band and recent low), with an extension to $38.50 if the neckline fails. Invalidation: a close above $42.10 (Bollinger midline). (50% probability)
- Scenario 2: Bullish Relief Bounce — The lower-band support holds and the RSI bounce extends, driving a push through EMAs toward the Bollinger midline. Trigger: a close above $41.60 with rising volume. Target: $42.10-$43.00. Invalidation: a break below $39.30. (30% probability)
- Scenario 3: Neutral Range Chop — Price oscillates between $39.40 and $41.60 as ADX stays low. Trigger: tight closes around VWAP of $40.70. Target: $40.50-$41.20. Invalidation: a move outside $39.00-$42.10. (20% probability)
PRICE TARGETS
- Target Price: $40.15 (6-day)
- Expected Range: $38.90 to $41.70 (width $2.80, about 6.8% of current price, consistent with the 4-8% guidance for a 6-day horizon)
- Key Levels: Support at $39.16, Resistance at $41.60
OVERALL BIAS
OVERALL BIAS: BEARISH - The bearish MACD crossover, −DI dominance, negative CMF, and price under the EMA13/EMA34 cluster inside a long-term downtrend (below both SMAs) outweigh the modest RSI bounce. The bounce from near the lower Bollinger Band may still push price toward $41.60 first, so conviction is moderate.
This is educational analysis and not financial advice.