ASTS 20-day bearish forecast — Nov 15, 2026
- Bias: Bearish
- Timeframe: 20 days (made Nov 15, 2026, target date Dec 4, 2026)
- Price at analysis: $32.60
- Price target: $30.50
- Expected range: $27.50 – $37.00
- Result: Pending — graded after the close on Dec 4, 2026
Get a free AI analysis of ASTS today
Analysis
TECHNICAL INDICATORS
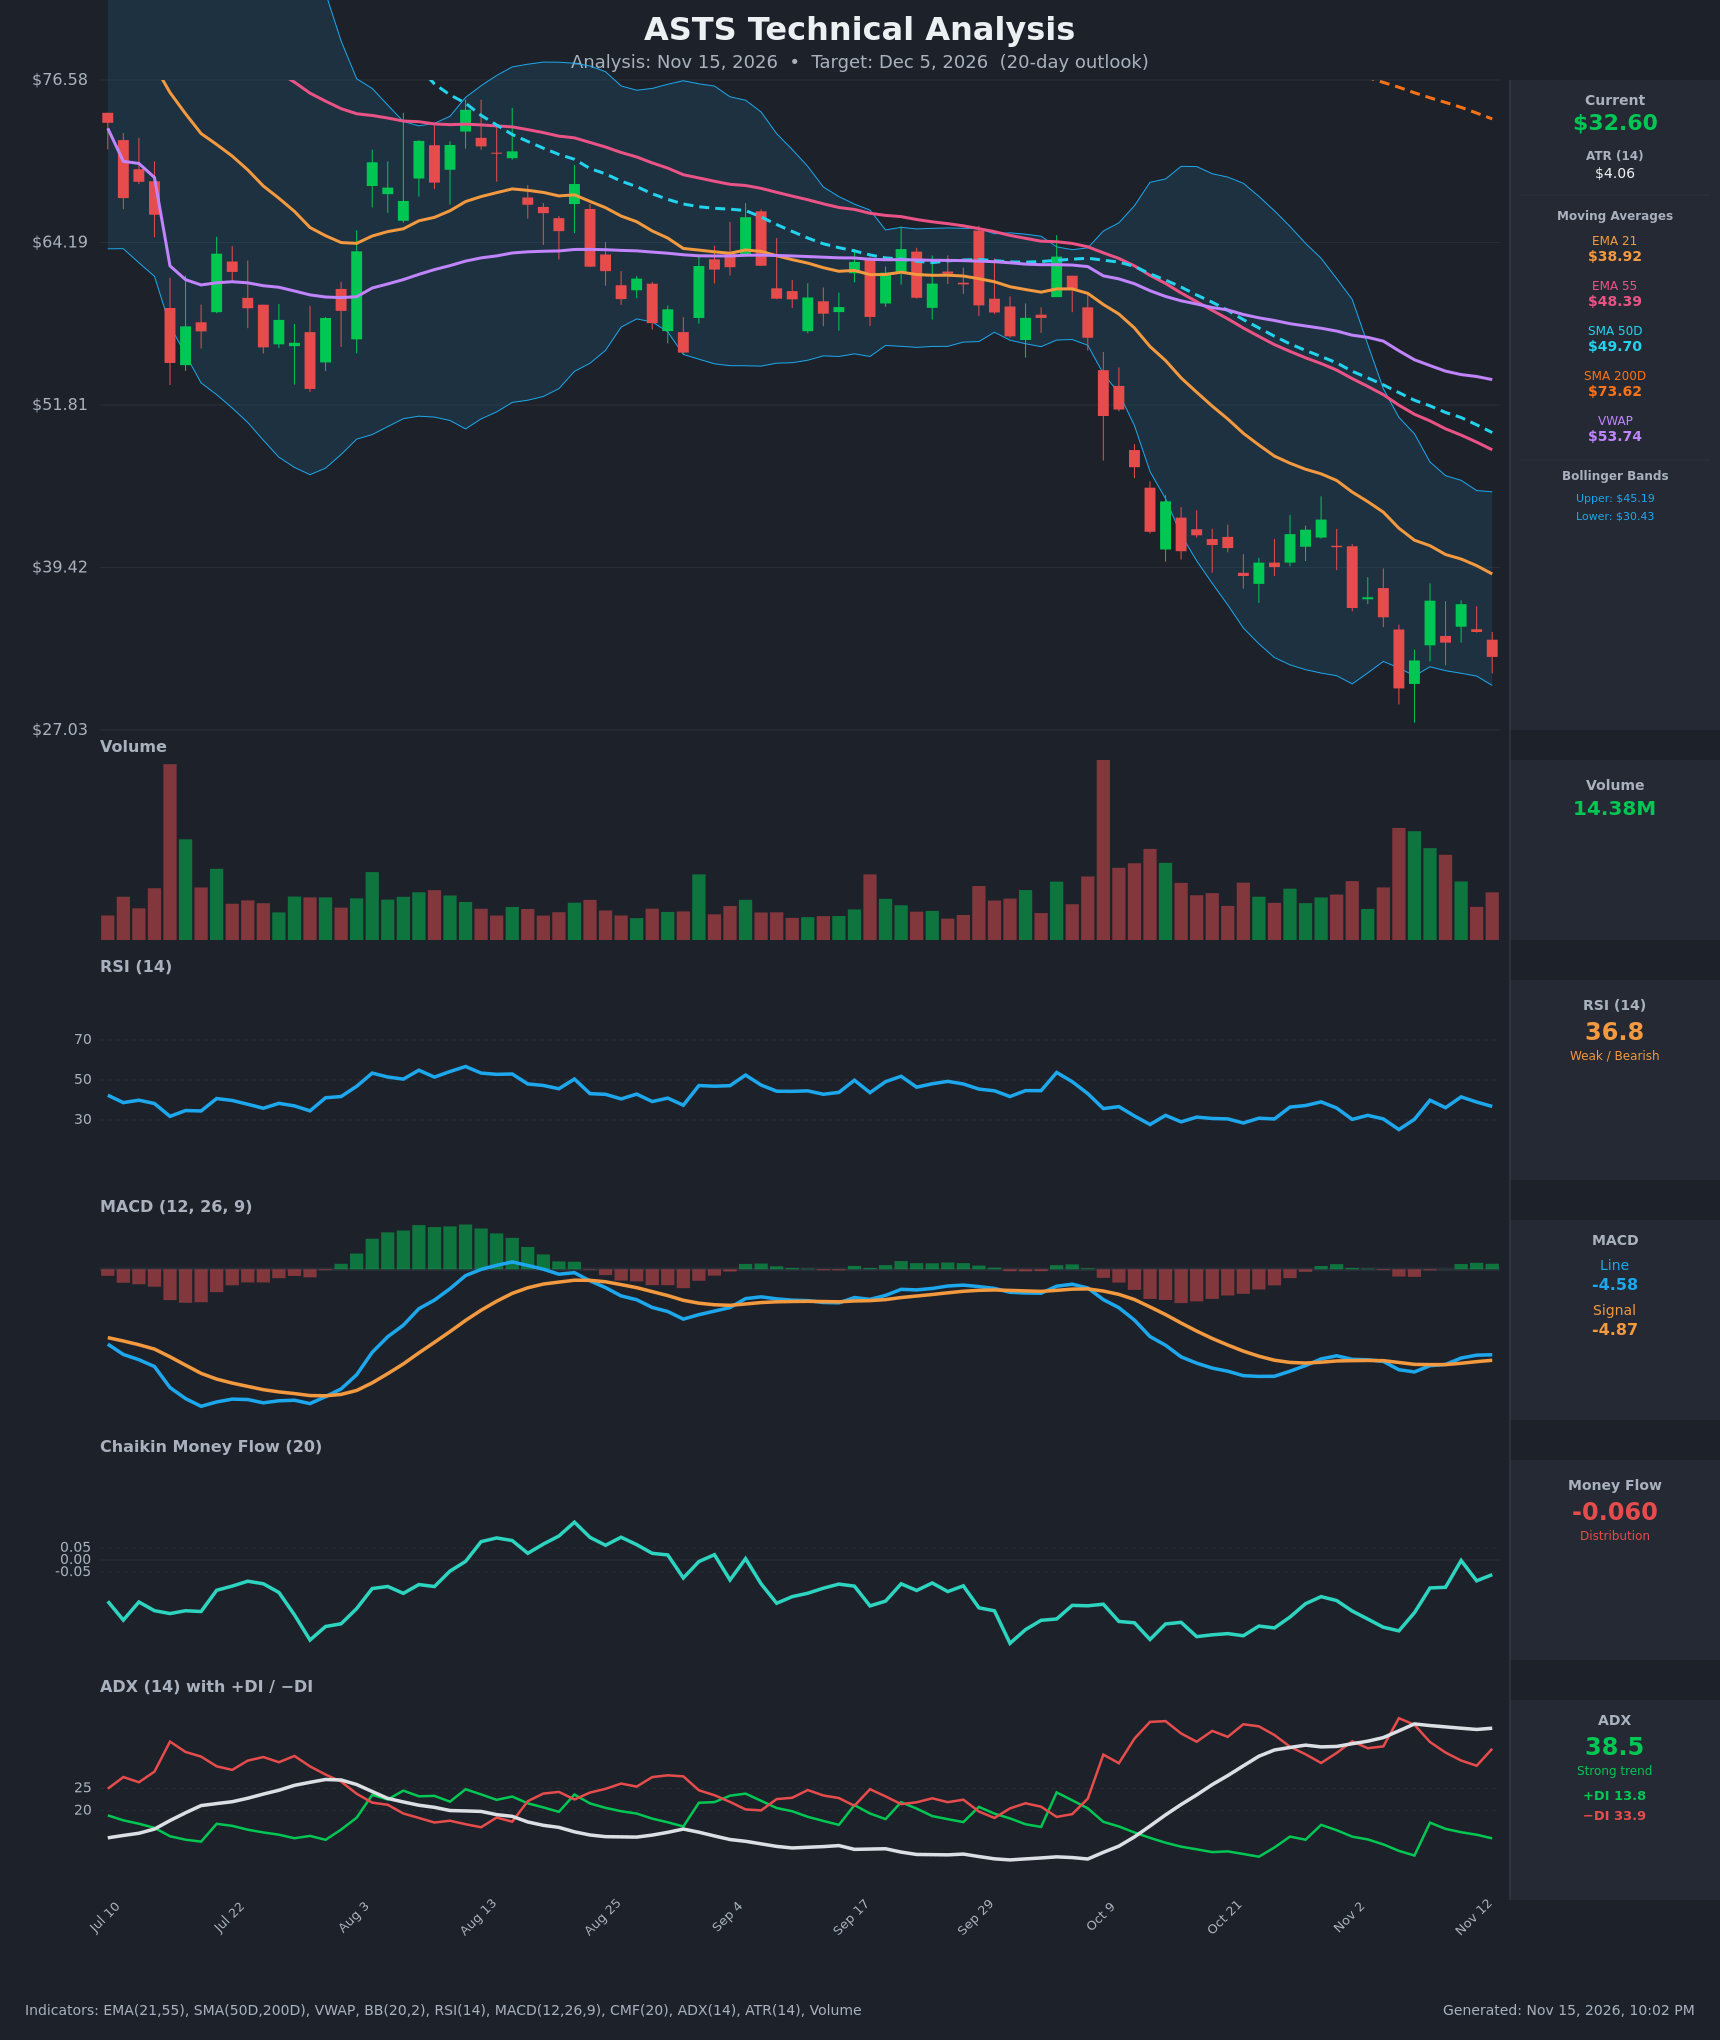
- RSI (14): 36.79, below neutral 50 but above oversold. It bounced from 25.2 on Nov 5 and has been making lower highs (41.6 on Nov 11, now 36.8). Momentum is weak and rolling over again. [Bearish]
- 20 EMA: The EMA 21 is $38.92, about 16% above price at $32.60. It is falling steadily (from $47.91 on Oct 26) and acts as overhead resistance. The EMA 21 is also below the EMA 55 ($48.39) and the SMA 50D ($49.70), so the moving averages are stacked bearishly. [Bearish]
- MACD: The line is -4.576 and the signal is -4.872, so the line is slightly above the signal (a marginal bullish crossover since Nov 11-12). The histogram is only about +0.30 and both lines are deeply negative. This is a shallow momentum improvement inside a downtrend, not a trend change. [Neutral]
- Bollinger Bands (20): Upper is $45.19 and lower is $30.43. Price at $32.60 sits in the lower quarter of the bands and has twice tested the lower band (the Nov 5 close of $30.20 was below it). The bands are wide, so volatility is elevated. Price is hugging the lower band in a "walk down" and the midline (~$37.8) is resistance. [Bearish]
- CMF (20): -0.060 is just below the -0.05 threshold, a mild distribution reading. It has improved from -0.292 (Nov 5) and touched about 0 on Nov 11, but it has turned down again. Buyers are not showing sustained conviction. [Distribution]
- ADX (14): 38.5 with −DI at 33.9 on top of +DI at 13.8, a wide gap. ADX has risen from about 33 to 39, so this is a strong, established downtrend with bears in firm control. [Strong Trend – Bearish]
- Volume: 14.38M on the latest bar, which is moderate and lower than the heavy selling in early October and early November. Red bars have been heavy through the decline, and green bounce bars have not reached comparable volume. This looks like a possible slowing of selling pressure, but there is no capitulation reversal signal yet. [Mildly Bearish / Declining Selling Pressure]
DIVERGENCES & TRENDS
- Price vs. RSI: The Nov 5 low of $30.20 had an RSI of 25.2. The current price of $32.60 is above that low but RSI is 36.8, so there is no clean divergence. A modest higher-low in price is the only constructive element.
- MACD: The marginal bullish crossover came from deeply negative levels. The line has barely risen since Nov 5 and is still around -4.6, so the crossover is weak and prone to failing.
- CMF: It improved from -0.29 to about 0 and then slipped back to -0.06. The bounce was not sustained, which is a lower-high pattern in money flow.
- Moving averages: Price is below the EMA 21, EMA 55, SMA 50D, SMA 200D and VWAP. The SMA 50D ($49.70) is well below the SMA 200D ($73.62), so a death cross is already in place. All of these are falling.
- DI/ADX: −DI has been above +DI since early October and ADX is rising, confirming strong trend continuation.
- Price action: Since Nov 5 price has been chopping between about $30 and $37, with lower highs ($43.07, $37.15, $36.89, $36.62), a basing attempt that has not broken the downtrend.
CHART PATTERNS
- Bearish flag / descending channel: After the sharp drop from about $60 to $40 in October, price consolidated and then fell again. The lower-high structure since late October resembles a bearish flag/pennant continuation. A measured move points lower.
- Possible Bullish Double Bottom (early stage): The lows at $30.20 (Nov 5) and the current $32.60 area could form a double bottom, but price has not broken the ~$37 neckline. It is unconfirmed and low probability while ADX is strong and bearish. A neckline break above $37 would target about $43.
- Bearish continuation: If $30.20 breaks, the next measured downside is around $26-27 (the chart's low axis is $27.03).
POTENTIAL SCENARIOS
- Scenario 1: Bearish Trend Continuation — Strong ADX, −DI dominance, and the stacked, falling moving averages favor another leg down. Price loses the $30.20-$30.43 support (lower Bollinger band) and slides toward the $26-28 area, with bounces capped near the EMA 21. Trigger: daily close below $30.20 on rising volume. Target: $27.00-$28.00. Invalidation: daily close above $37.50 (the Bollinger midline and recent lower highs). (50% probability)
- Scenario 2: Neutral Range-Bound Base — Price holds the $30-$31 support and chops between $30 and $37 as selling exhausts, with the MACD marginally positive and CMF near zero. Trigger: repeated holds above $30.20 with contracting volatility. Target: $31-$35. Invalidation: close below $30 or above $38. (28% probability)
- Scenario 3: Bullish Relief Rally / Double Bottom — A bounce from the oversold zone with a MACD crossover and CMF turning positive pushes price toward the EMA 21 resistance. Trigger: close above $37 on increased volume. Target: $39-$43. Invalidation: close back below $32. (22% probability)
PRICE TARGETS
For the 20-day timeframe (to Dec 5, 2026), the guidance is a range width of about 8-12% for 14-21 days. ATR is $4.06 (about 12.5% of price) and volatility is elevated, so I am using a range at the upper end of that guidance.
- Target Price: $30.50 (a bearish drift below the current $32.60 toward the lower Bollinger band)
- Expected Range: $27.50 to $37.00 (width $9.50, about 29% of price: this sits above the 8-12% formula because ATR is about 12.5% of price and 20 days of that volatility compounds. It is still 2-3x wider than a 2-3 day range.)
- Key Levels: Support at $30.20, Resistance at $37.00
Note on the self-check: a strictly formula-based range would be about $30.00 to $35.50 (roughly 17%), but with ATR at $4.06 that would likely be hit within a few days, so I am keeping a wider range that reflects the actual volatility.
OVERALL BIAS
OVERALL BIAS: BEARISH - ADX of 38.5 with −DI (33.9) far above +DI (13.8), price below every key moving average (death cross in place), and CMF back in distribution all favor trend continuation. The marginal MACD crossover and the proximity to the lower Bollinger band raise the odds of relief bounces, but they do not change the trend. Resistance sits at $37-$39.
This is educational analysis and not financial advice.