ASTS 48-day bearish forecast — Nov 15, 2026
- Bias: Bearish
- Timeframe: 48 days (made Nov 15, 2026, target date Jan 1, 2027)
- Price at analysis: $32.60
- Price target: $28.50
- Expected range: $22.50 – $39.00
- Result: Pending — graded after the close on Jan 1, 2027
Get a free AI analysis of ASTS today
Analysis
TECHNICAL INDICATORS
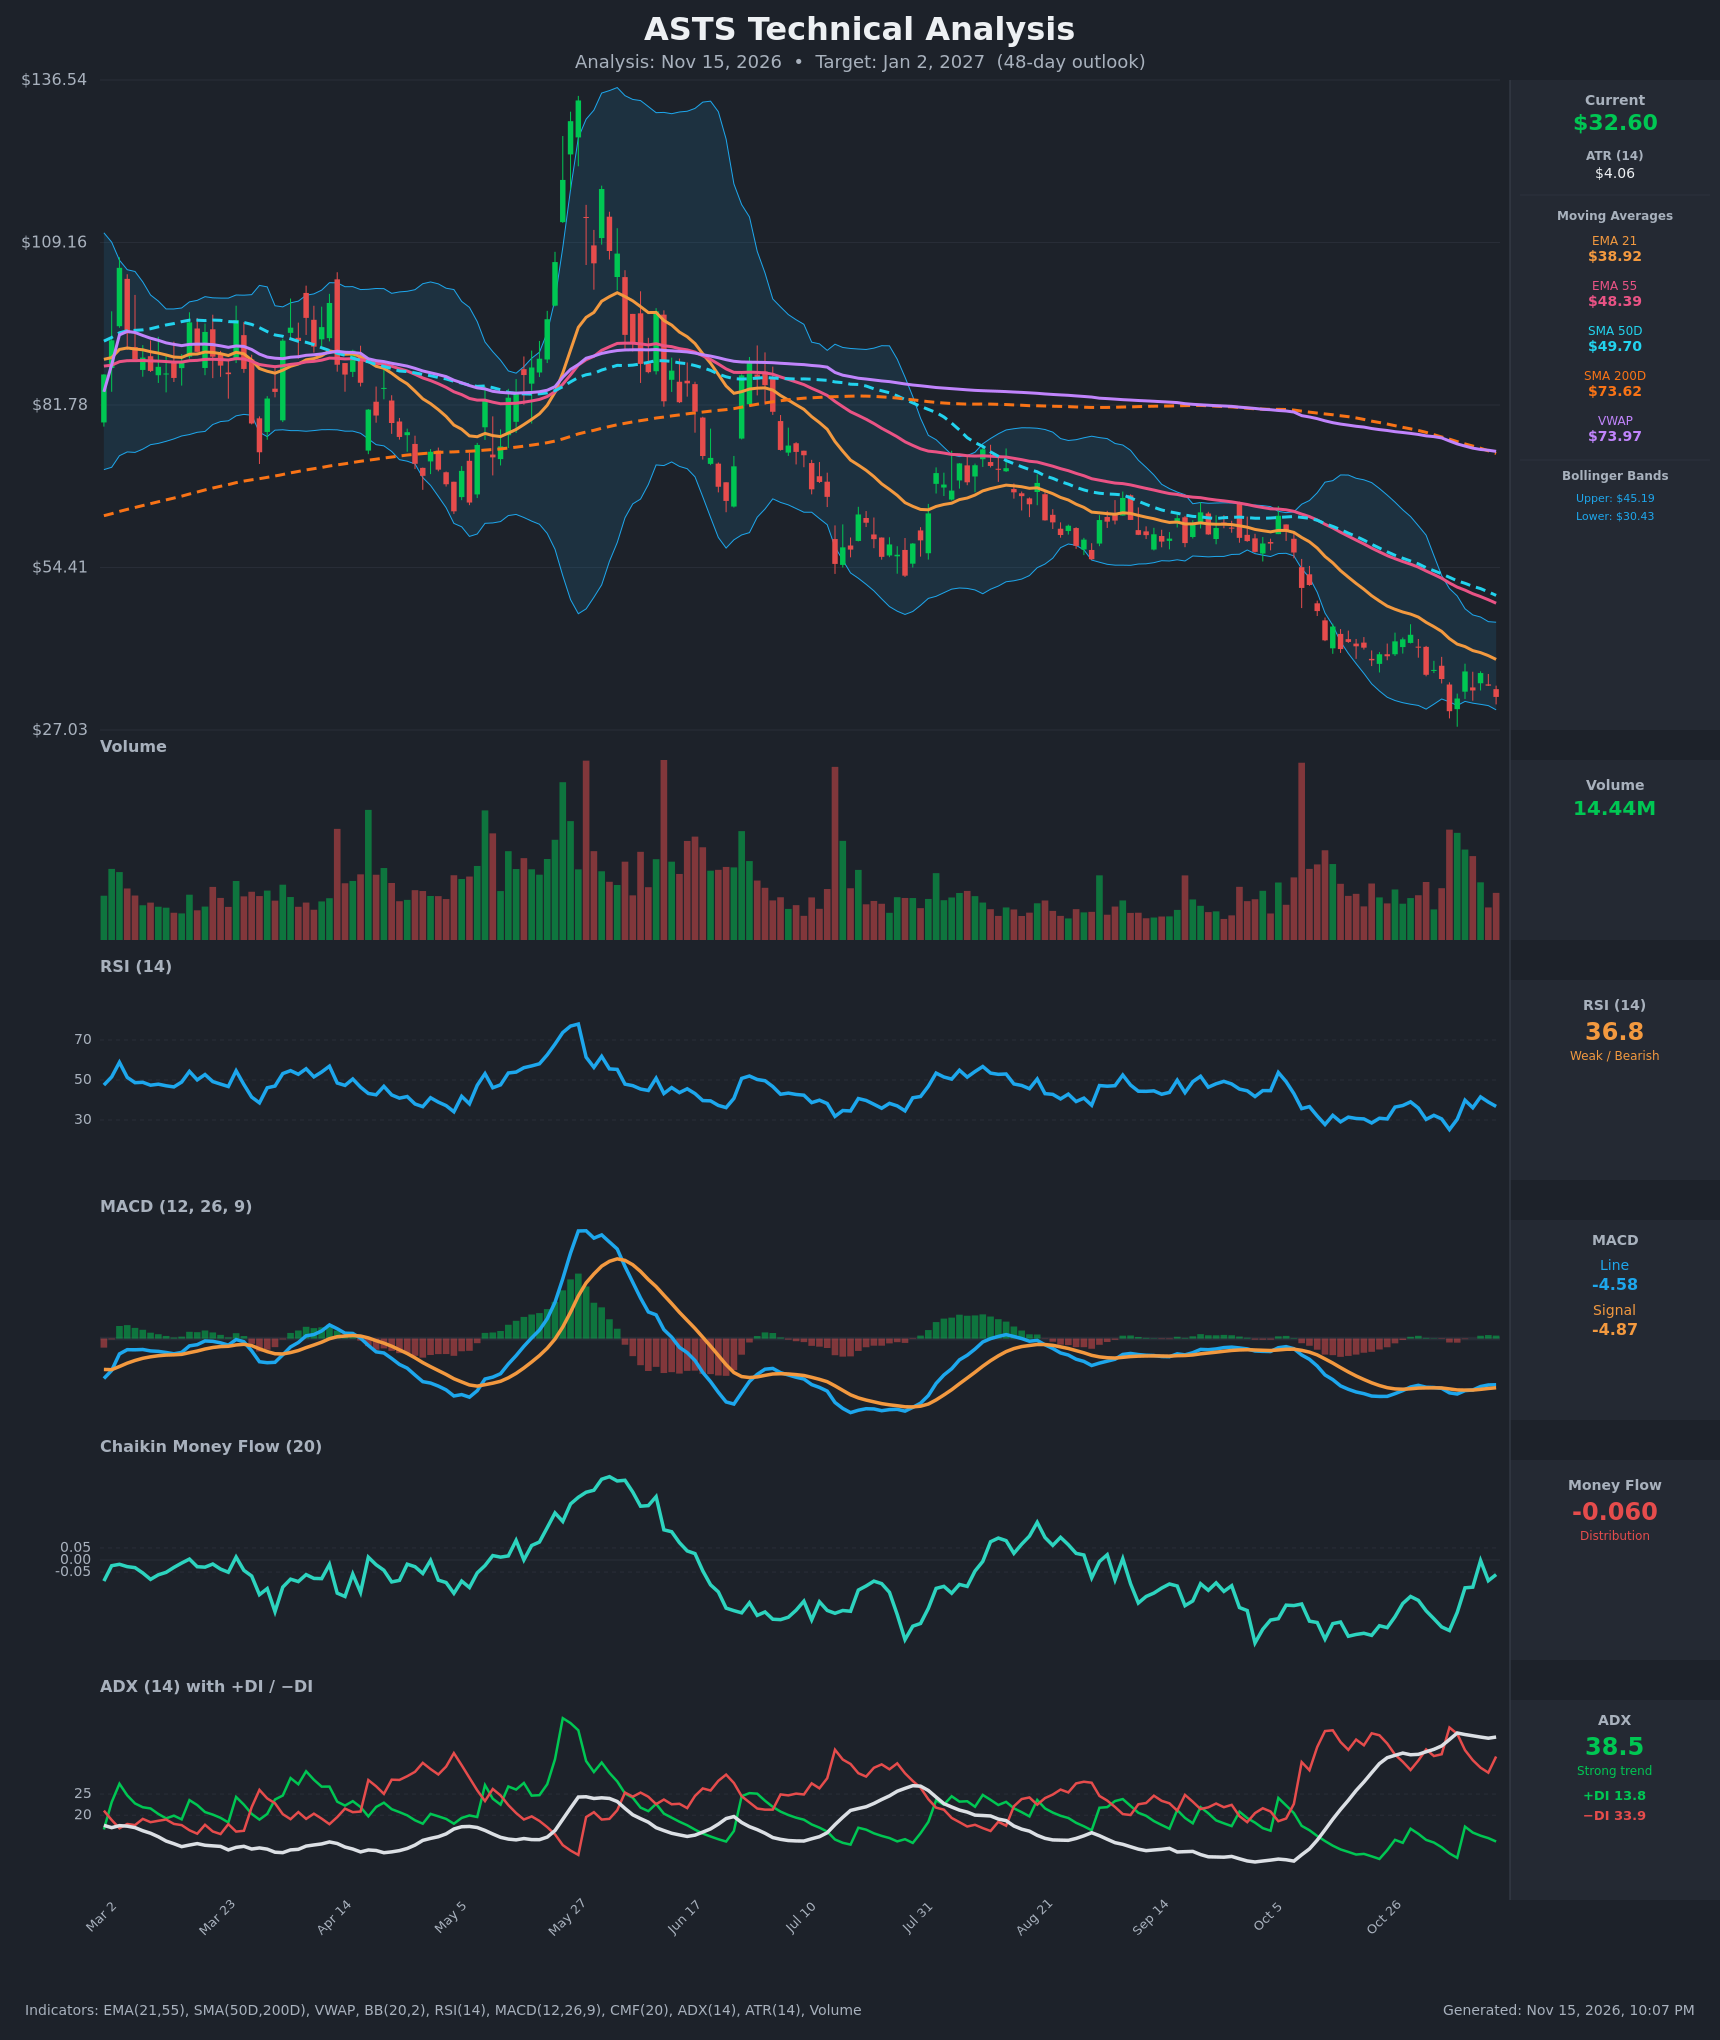
- RSI (14): 36.79, below 50 and above the oversold line at 30. It bounced from 25.2 on Nov 5 but has made lower highs (41.6 on Nov 11, then 36.8). Momentum is weak and has not recovered. [Bearish]
- 20 EMA (EMA 21): $38.92, with price at $32.60 about 16% below it. The EMA is falling steadily (from $47.91 on Oct 26) and acts as overhead resistance. EMA 21 is also below EMA 55 ($48.39), and both sit far below the SMA 50D ($49.70) and SMA 200D ($73.62). [Bearish]
- MACD: Line -4.576 is slightly above Signal -4.872, so the histogram is a small positive (about +0.30). The line is deeply negative and the bullish cross is marginal. It is a mild momentum stabilization inside a larger downtrend, not a reversal. [Neutral]
- Bollinger Bands (20): Upper $45.19, lower $30.43, so price sits in the lower third, about 15% of the band width above the lower band. Price tagged or pierced the lower band on Nov 5 ($30.20) and is again near it. The band midline (about $37.8) is falling. This is a "walking the band" downtrend and the bands are not signaling a squeeze. [Bearish]
- CMF (20): -0.060, just below the -0.05 threshold. It has improved from -0.292 on Nov 5 and touched about 0 on Nov 11, but it has turned back down. Selling pressure is marginal but persistent. [Distribution]
- ADX (14): 38.5 with −DI 33.9 above +DI 13.8. That is a strong, established downtrend. ADX has flattened and eased slightly from its 39.4 peak, so trend strength is plateauing and the downtrend may be maturing. [Strong Trend – Bearish]
- Volume: 14.44M on the latest bar, which is moderate after the heavy-volume selloff in late October and early November. Volume is not expanding on the bounces, so there is little sign of capitulation reversal buying. [Neutral-to-Bearish]
DIVERGENCES & TRENDS
- Price vs. RSI: Price made a lower low at $30.20 on Nov 5 with RSI at 25.2. The current price of $32.60 has RSI at 36.8, with no clear bullish divergence yet. The RSI lows are not clearly higher than the price lows.
- MACD: The MACD line has formed a very shallow base around -5, and a tiny bullish crossover has just occurred. This shows selling momentum decelerating but not reversing.
- CMF: It improved from -0.29 to about 0 and has now slipped back. This is a mild positive divergence that failed to confirm.
- Moving average structure: Price < EMA21 < EMA55 < SMA50D < SMA200D < VWAP is a fully bearish stack. The SMA50D ($49.70) is sliding toward the SMA200D ($73.62), and a death cross is already in effect (SMA50D below SMA200D). The EMA21/EMA55 bearish cross happened long ago.
- Trend: The stock fell from a peak near $130 in late May to about $32, a drop of roughly 75%. Lower highs and lower lows have persisted since, and the October breakdown through the $55-60 support was steep.
- Bounce failures: Rallies to $43 (Oct 29) and $36.89 (Nov 9) were sold quickly, so rebounds are being faded.
CHART PATTERNS
- Primary pattern: A large-scale Bearish Rising Wedge / downtrend continuation is not present. The more relevant read is a Bearish Flag/Pennant-style consolidation on the recent small-range sideways action between about $30 and $37 after the sharp October drop. A breakdown below $30 would project a measured move of roughly the October pole (about $55 → $37, ~$18) to roughly $12-15, though a full measured move is unlikely within 48 days.
- Possible Bullish Double Bottom: The lows at $30.20 (Nov 5) and the retest near $32 are a potential early double-bottom or base. It needs a close above the neckline at about $37 (the Nov 9 high), then the EMA21 at about $39, to be confirmed. It is currently unconfirmed.
- Significance: Downtrend continuation is more probable given the ADX/DI structure, but oversold conditions raise the odds of a relief bounce toward $38-43, where the EMA21 and the middle/upper Bollinger Band will act as resistance.
POTENTIAL SCENARIOS
- Scenario 1: Bearish Downtrend Continuation — Price fails at the falling EMA21 and breaks below the $30 low, with −DI remaining dominant and ADX holding above 30. Trigger: daily close below $30.20 on rising volume. Target: $25-26, with an extension toward $22. Invalidation: close above $39 (EMA21). (50% probability)
- Scenario 2: Neutral Range Consolidation / Base Building — Price chops between $29 and $39 as the selloff exhausts and the MACD stays flat. Trigger: holds above $30 with RSI staying in the 35-50 range. Target: $31-35 range. Invalidation: close outside $29-$39. (20% probability)
- Scenario 3: Bullish Relief Rally — An oversold bounce forms a double bottom and reclaims the neckline at $37. Trigger: close above $37 with CMF turning positive above +0.05. Target: $41-45 (upper Bollinger Band / EMA 21 zone). Invalidation: close below $30. (30% probability)
PRICE TARGETS
For the 48-day timeframe (range width guidance ~12-18% for 30-60 days, widened modestly for ASTS's high volatility; ATR is $4.06, about 12% of price):
- Target Price: $28.50 (the bearish bias outweighs the relief-rally potential, so price is expected to end modestly below current)
- Expected Range: $22.50 to $39.00 (width $16.50 = ~50.6% of current price; this is deliberately wider than the 12-18% guide because ATR is already ~12.5% of price and 48 days spans many ATR units. A 48-day move under typical volatility easily exceeds the standard formula)
- Key Levels: Support at $30.20, Resistance at $38.92
OVERALL BIAS
OVERALL BIAS: BEARISH - Price sits below every moving average with −DI (33.9) dominating +DI (13.8), ADX at 38.5, and CMF in mild distribution. The marginal MACD cross and oversold bounces offer only a relief-rally risk toward the $39 EMA21, which should act as resistance.
This is educational analysis and not financial advice.