ASTS 83-day bearish forecast — Nov 15, 2026
- Bias: Bearish
- Timeframe: 83 days (made Nov 15, 2026, target date Feb 5, 2027)
- Price at analysis: $32.60
- Price target: $29.50
- Expected range: $25.50 – $35.00
- Result: Pending — graded after the close on Feb 5, 2027
Get a free AI analysis of ASTS today
Analysis
TECHNICAL INDICATORS
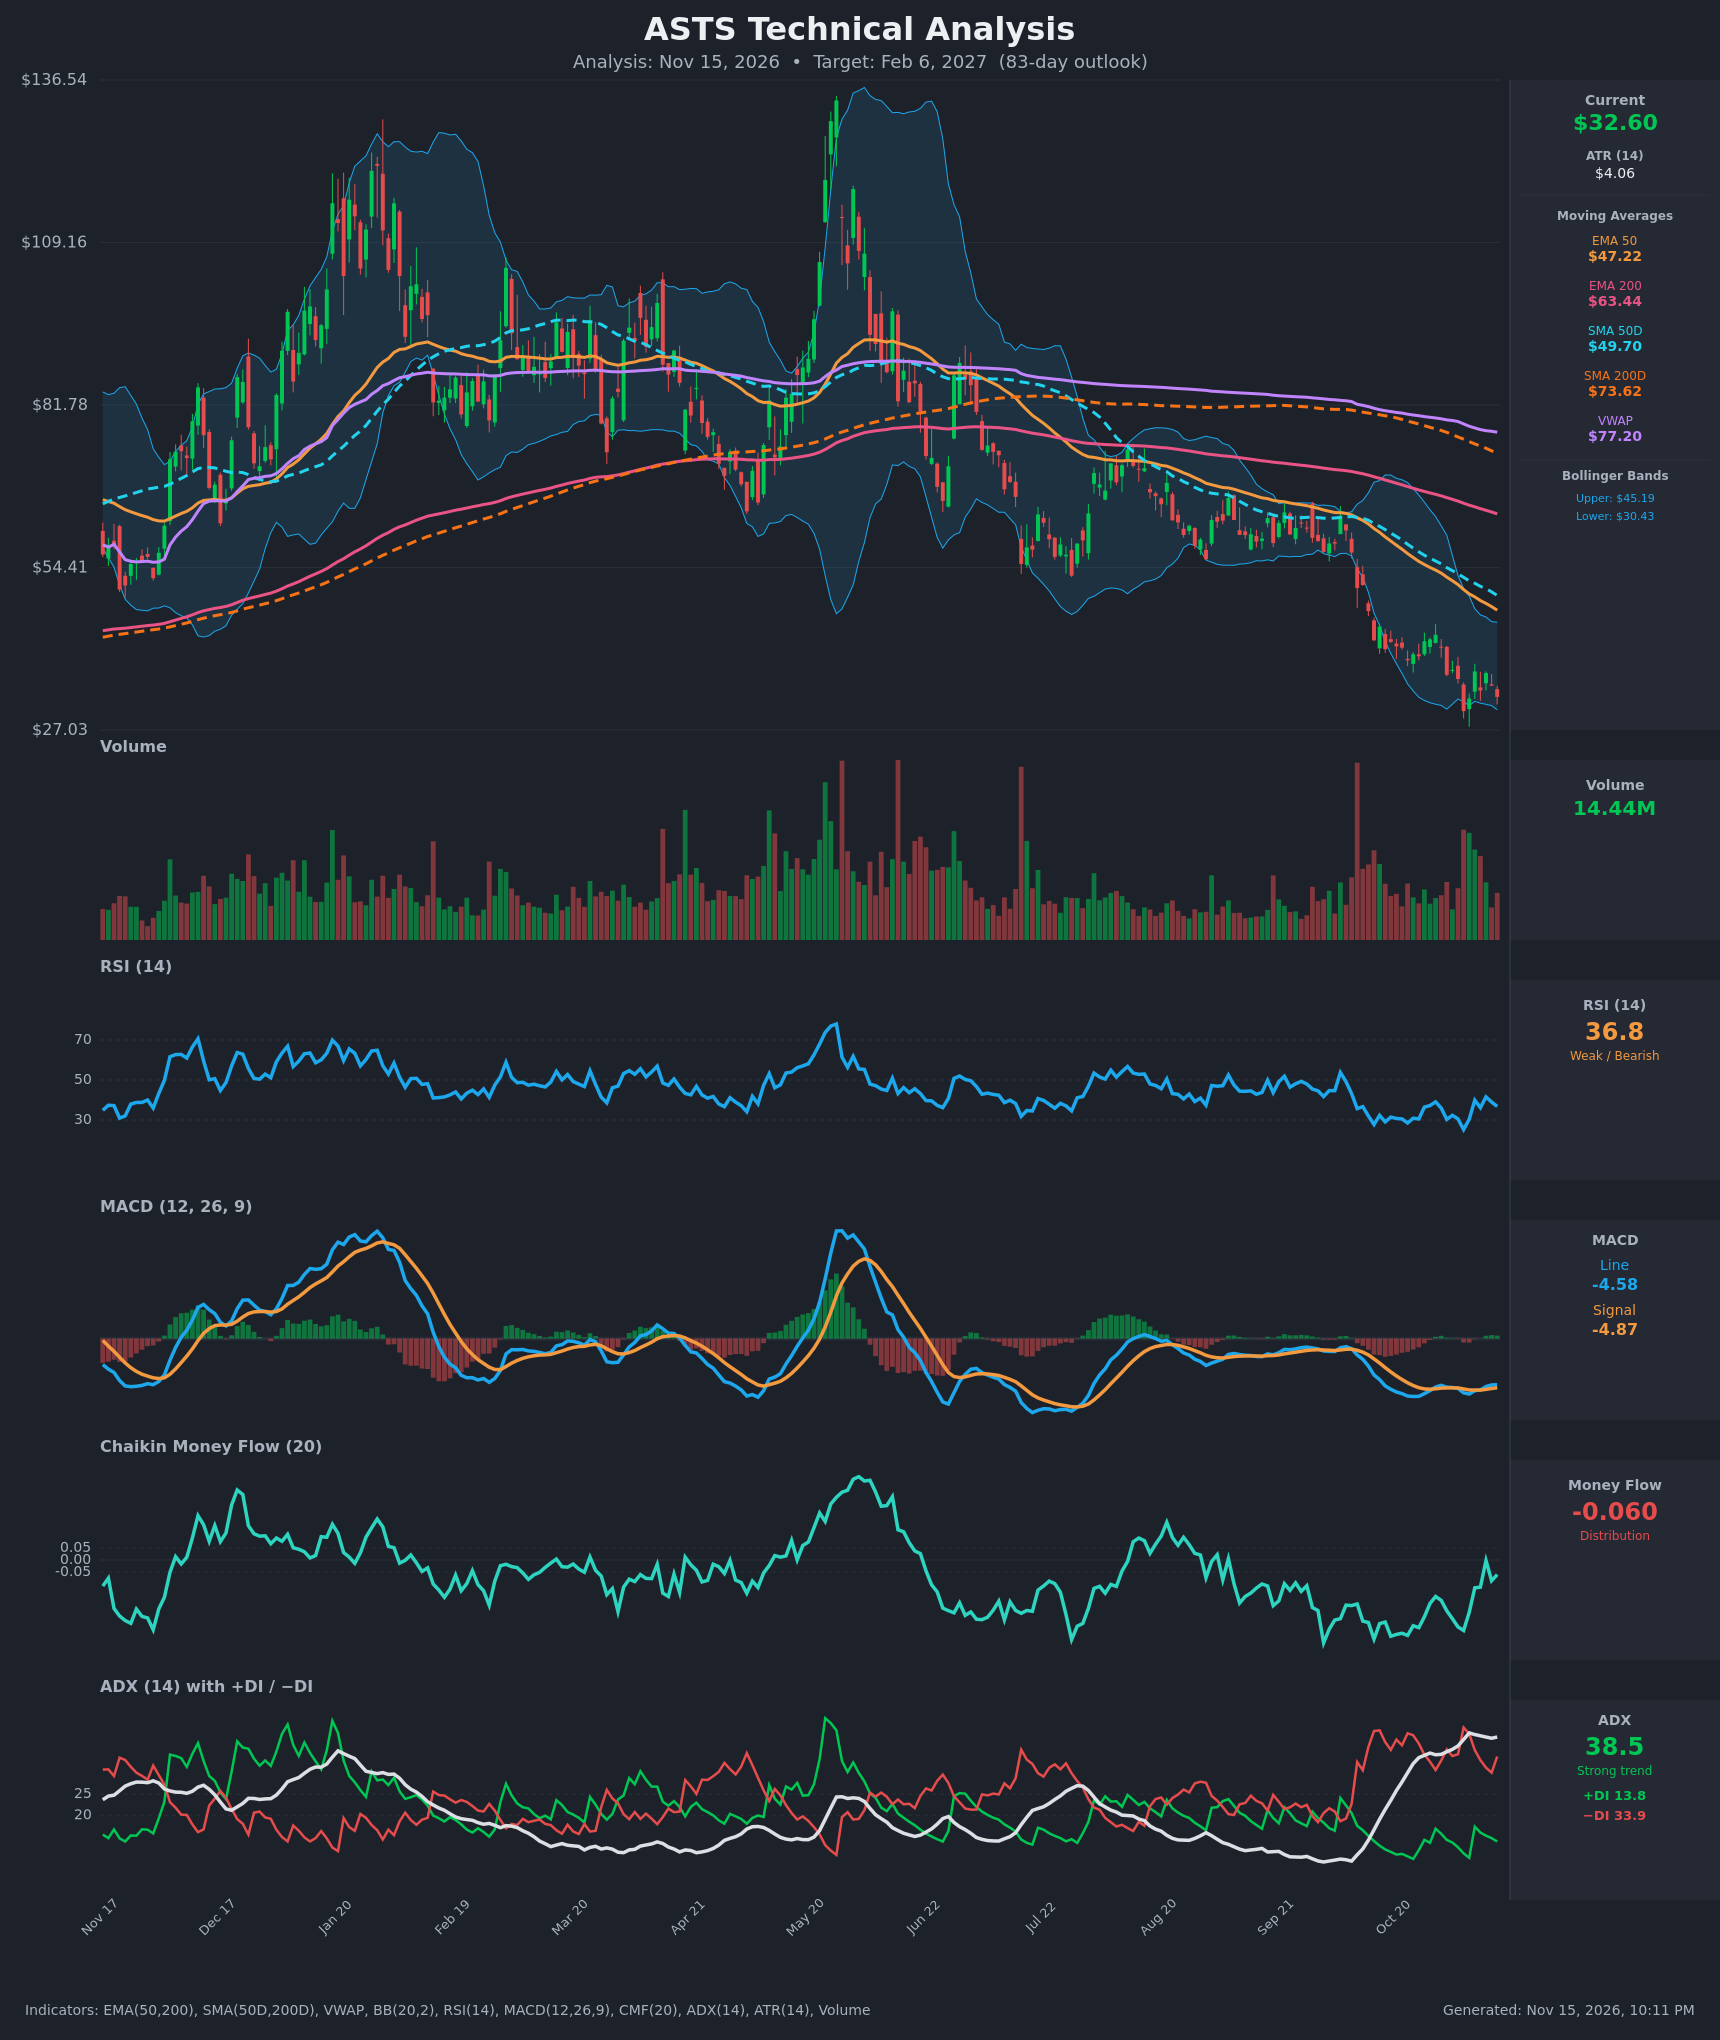
- RSI (14): 36.79, in the weak zone but not oversold. It bounced from 25.2 on Nov 5 and has been making a series of lower highs (41.6 on Nov 11, now 36.8). Momentum is still tilted down, with a modest relief attempt that is fading. [Bearish]
- 20 EMA: The 20 EMA isn't supplied. The 50 EMA is $47.22 and the 200 EMA is $63.44, and price at $32.60 sits about 31% below the 50 EMA. Both are falling steadily and act as heavy overhead resistance. [Bearish]
- MACD: Line -4.576 is just above signal -4.872, a small bullish crossover on Nov 11-12 with a slightly positive histogram. Both lines are deeply negative and near the zero-line floor, so this is a weak, low-conviction momentum stabilization inside a downtrend. [Neutral]
- Bollinger Bands (20): Upper $45.19, lower $30.43, so price at $32.60 sits in the lower quarter of the band. The bands are widening and sloping down, and price has been riding or hugging the lower band (a "band walk"), which signals trend persistence rather than a reversal. [Bearish]
- CMF (20): -0.060, just below the -0.05 distribution threshold. It has improved from -0.29 on Nov 5 and touched -0.002 on Nov 11, but it slipped back into mild distribution. Selling pressure is easing, not reversed. [Distribution]
- ADX (14): 38.5 and rising, with -DI at 33.9 well above +DI at 13.8. This is a strong, established downtrend with bears firmly in control. ADX has held 33-39 for two weeks. [Strong Trend – Bearish]
- Volume: 14.44M, elevated versus the average volume of recent months. Heavy volume during the Oct-Nov breakdown (red spikes) confirms the selling. Volume on the bounces has been lighter and inconsistent, which points to distribution rather than accumulation. [Bearish – selling confirmed by volume]
DIVERGENCES & TRENDS
- No clean bullish divergence: The Nov 5 low at $30.20 had RSI at 25.2. The pullback to $32.60 has RSI at 36.8 and MACD histogram turning positive, which is mild momentum improvement but not a confirmed divergence, since price has not made a lower low.
- MACD: It has crossed above its signal line, but both remain near their lows. Prior signal-line crosses in this decline (Aug-Sep) failed and led to new lows.
- Moving averages: Price is far below EMA50, EMA200, SMA50D ($49.70) and SMA200D ($73.62). EMA50 is below EMA200, and SMA50D ($49.70) is below SMA200D ($73.62), a death-cross structure that has been in place for months. VWAP at $77.20 is far above price, which marks structural seller control.
- DI lines: -DI has been above +DI throughout, with no bullish DI crossover. +DI spikes (17.3 on Nov 9) were quickly rejected.
- CMF: It has been mostly negative for months, apart from a short positive stretch in early Oct. The recent upward tick is a minor improvement.
- Price structure: Lower highs from the May peak near $130, then a breakdown from the $55-65 range in October. The $30-37 area is the first notable base since the breakdown.
CHART PATTERNS
- Bearish Descending Triangle / range breakdown (continuation): Price consolidated around $55-65 from Aug to Oct, then broke down. The measured move of that range (about $10-12 plus the prior leg) points toward the $30 area, which has largely been achieved. Further downside would be an extension.
- Potential Bullish Double Bottom (reversal), unconfirmed: Lows near $30.20 (Nov 5) and a retest around $32-33 form a possible double bottom. The neckline is about $36.60-36.90 (the Nov 9-11 highs). A close above it would target about $43 (neckline plus pattern height of roughly $6.5). It has not triggered, and the trend context (ADX 38, -DI dominant) makes bottom patterns less reliable.
- Overall: The dominant structure is a downtrend continuation, with the double bottom as the main bullish alternative.
POTENTIAL SCENARIOS
- Scenario 1: Bearish Trend Continuation — The strong ADX/-DI dominance, a price that stays below all moving averages, and band-walking behavior suggest that the bounce attempt fails below the $36-37 zone, with a retest and break of the $30.20 low. Trigger: daily close below $30.20 (lower Bollinger Band at $30.43 as the first warning). Target: $26-28, with an extension to about $25. Invalidation: daily close above $36.90 with MACD histogram expanding. (50% probability)
- Scenario 2: Bullish Relief Rally / Double Bottom — Seller exhaustion at the $30 floor, improving CMF and a positive MACD cross drive a double-bottom breakout. Trigger: close above $36.90 on rising volume, with CMF moving above +0.05. Target: $43-45 (upper Bollinger Band, near the declining EMA50 at about $45-47). Invalidation: close below $30.20. (33% probability)
- Scenario 3: Neutral Basing Range — Price chops between $29 and $37 as volatility compresses and trend strength fades. Trigger: ADX rolling over below 25 with price holding $30-37. Target: $32-34. Invalidation: close outside $29-$37. (17% probability)
PRICE TARGETS
- Target Price: $29.50 (83 days, Feb 6, 2027)
- Expected Range: $25.50 to $35.00 (width $9.50, about 29% of current price, consistent with the 61-180 day guidance of 18-30% and with ATR of $4.06 or about 12% of price)
- Key Levels: Support at $30.20, Resistance at $36.90
OVERALL BIAS
OVERALL BIAS: BEARISH - ADX of 38.5 with -DI (33.9) far above +DI (13.8), price below every major moving average and VWAP, band-walking at the lower Bollinger Band, and a persistent death-cross structure outweigh the minor MACD cross and CMF improvement. The $30.20 low is the key level, and a breakdown would extend the downtrend. Conviction is modest because a double-bottom reversal is a credible alternative.
This is educational analysis and not financial advice.