ASTS 4-day bearish forecast — Nov 1, 2026
- Bias: Bearish
- Timeframe: 4 days (made Nov 1, 2026, target date Nov 4, 2026)
- Price at analysis: $40.99
- Price target: $40.30
- Expected range: $39.30 – $41.40
- Result: Correct (-13.5%) — closed at $35.47 on Nov 4, 2026; quality score 50/100
Get a free AI analysis of ASTS today
Analysis
TECHNICAL INDICATORS
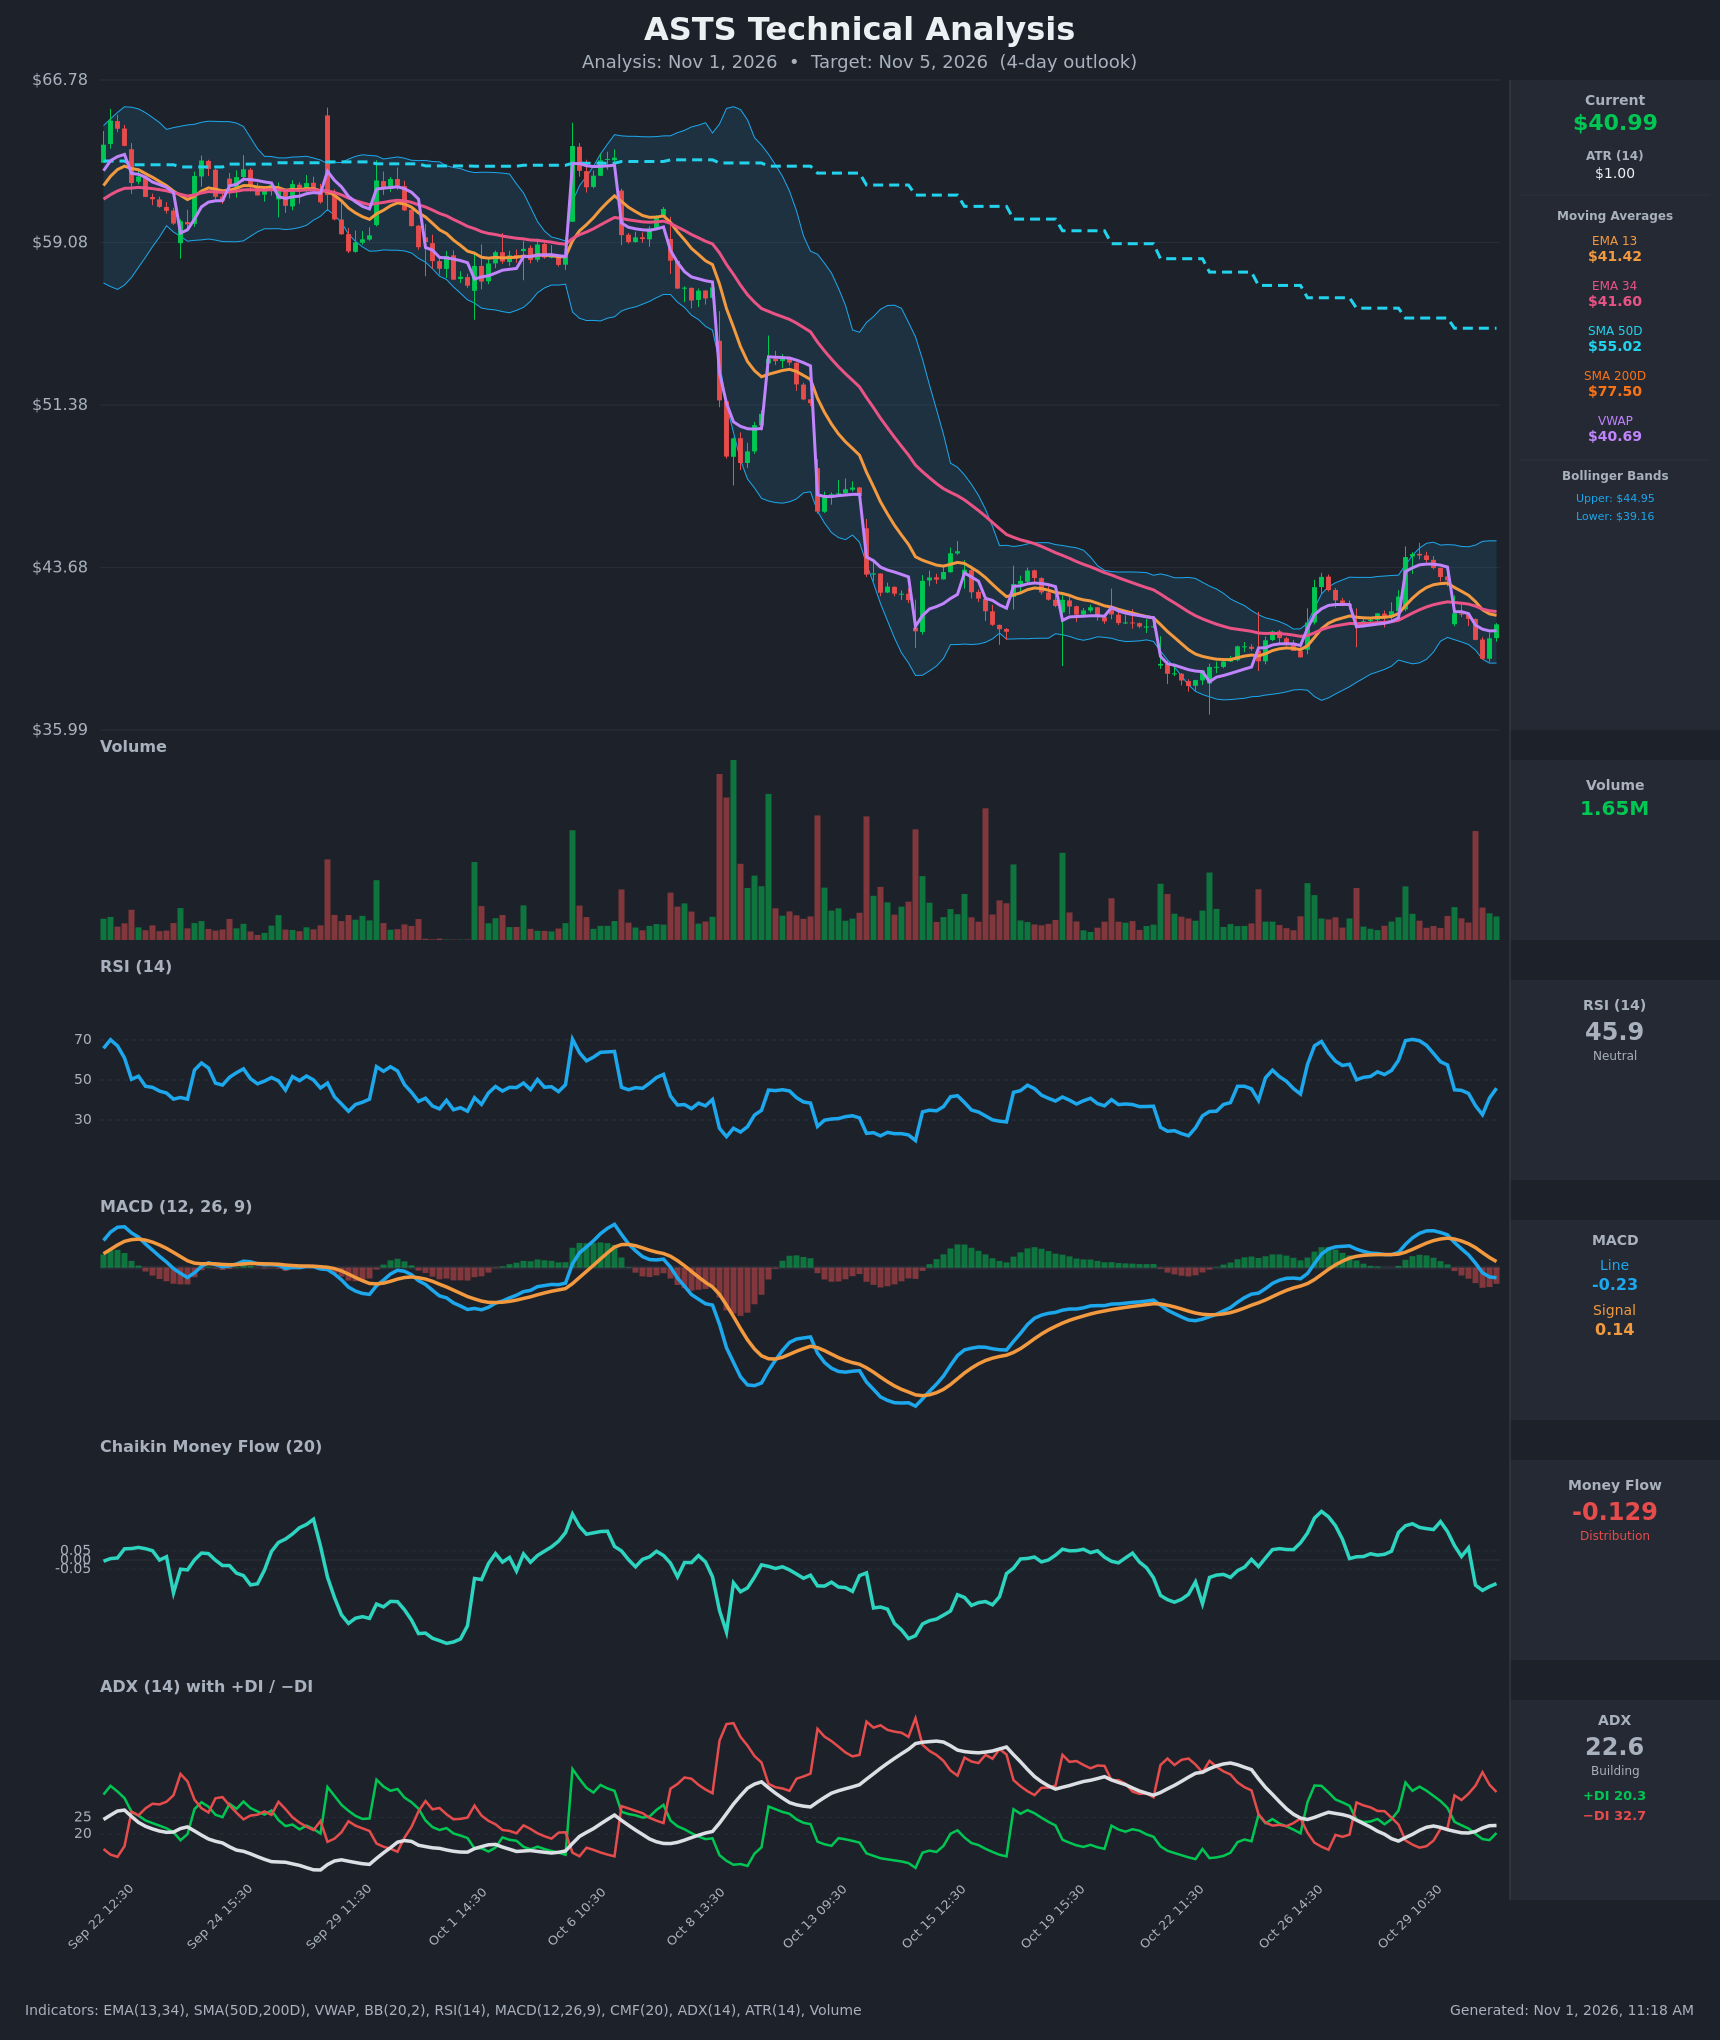
- RSI (14): 45.89. It bounced from 32.7 (near oversold) at the Oct 30 13:30 low, so short-term momentum is recovering. It remains below 50 and well under the 59–70 readings from Oct 29, so it shows no real strength yet. [Neutral]
- 20 EMA: The data supplies EMA 13 at $41.42 and EMA 34 at $41.60. Price at $40.99 is below both, and the EMA13 has crossed below the EMA34 (Oct 30 13:30). Both now act as overhead resistance, just above price. [Bearish]
- MACD: The line (-0.233) crossed below the signal (0.140) on Oct 30 at 09:30 and has since fallen through zero. The histogram is negative and widening, so momentum is bearish, though the line is flattening after the sharp drop. [Bearish]
- Bollinger Bands (20): Upper $44.95, lower $39.16, midline about $42.05. Price is in the lower third, about $1.83 above the lower band. The bands are fairly narrow compared with the Oct selloff, which suggests contained volatility. The Oct 30 low at $39.36 held just above the lower band, so a bounce toward the midline is possible, but the midline sits above the EMAs as resistance. [Neutral]
- CMF (20): -0.129, below the -0.05 threshold. It turned from positive (+0.21 on Oct 29) to negative within a day, showing a clear flip to distribution and selling pressure. [Distribution]
- ADX (14): 22.6, just under the 25 trend threshold and slightly rising. −DI (32.7) is well above +DI (20.3), after the bearish DI crossover on Oct 30 at 09:30. Trend strength is moderate and the bears control direction. [Moderate Trend – Bearish]
- Volume: 1.65M on the latest bar, near average. The heavy-volume red bar on the Oct 30 open marked a distribution/breakdown day, and the bounce on average volume lacks conviction. [Bearish-leaning / no confirmation of bounce]
DIVERGENCES & TRENDS
- Long-term trend: Price is far below both the SMA50D ($55.02) and the SMA200D ($77.50), and the SMA50 is below the SMA200 (death cross already in place). The primary trend is firmly bearish.
- Moving averages: The EMA13 crossed below the EMA34 on Oct 30, a bearish short-term crossover. Price is trying to reclaim them from below (EMA13 $41.42 is only +1% away).
- MACD: The bearish crossover is fresh, and the histogram turned negative after the Oct 29 peak.
- RSI: It shows a slight bounce from 32.7, but there is no bullish divergence. The price low on Oct 30 ($39.36) is above the earlier Oct 22 low (~$36.5), so higher lows are forming on the broader range, a mild stabilization sign.
- DI and ADX: The bearish DI crossover is confirmed, but ADX below 25 means the trend is not strongly extended.
- CMF: It turned negative after a rally failure at ~$44.3 near the upper Bollinger Band, a sign of a failed breakout and supply above $44.
- VWAP: Price ($40.99) is slightly above VWAP ($40.69), a small intraday positive that is easily lost.
CHART PATTERNS
- Rejection and range after a large downtrend: Price has been ranging between about $36.5 and $44.5 since Oct 15–22. The failure at the Oct 29 high (~$44.3) and the lower high after the downtrend resemble a Bearish Rectangle/Flag continuation (Bearish Flag/Pennant in the reference). A break below ~$39.3 would target the Oct 22 low zone near $36.5–$37.
- Possible Bullish Double Bottom: The ~$36.5 low and the $39.36 retest show an early double-bottom or higher-low attempt. It needs a close above $44.5 (the neckline) to confirm, which is unlikely within 4 days given overhead EMA resistance.
- Significance: The bearish continuation read is favored given the death cross, MACD and DI signals, and negative CMF. The measured downside is about $2–3 if $39.16 breaks. The 4-day move is likely constrained by the range floor.
POTENTIAL SCENARIOS
- Scenario 1: Bearish Rejection at the EMAs and Retest of Range Lows — Price fails at the EMA13/34 cluster (~$41.40–41.60), and with −DI dominance, negative MACD and CMF, drifts back toward the lower Bollinger Band. Trigger: rejection at $41.40–$41.60 or a loss of VWAP ($40.69). Target: $39.30–$39.70, extending to $38.00 if $39.16 breaks. Invalidation: a daily close above $42.05 (Bollinger midline). (55% probability)
- Scenario 2: Bullish Relief Bounce — Oversold bounce from the lower band, with RSI recovering and price reclaiming the EMAs and the midline. Trigger: a hold above VWAP and a close above $41.60 on rising volume. Target: $42.00–$43.00, then $44.00. Invalidation: a drop below $39.16. (30% probability)
- Scenario 3: Neutral Chop — Price stays in a narrow $39.50–$41.80 band, pinned between the lower band and the EMA cluster. Trigger: low-volume, indecisive candles. Target: ~$40.80–$41.00. Invalidation: a close outside $39.16–$42.05. (15% probability)
PRICE TARGETS
- Target Price: $40.30 (4-day, Nov 5, 2026)
- Expected Range: $39.30 to $41.40 (width $2.10 ≈ 5.1% of current price, consistent with ~2 ATR over 4 days)
- Key Levels: Support at $39.16, Resistance at $41.60
OVERALL BIAS
OVERALL BIAS: BEARISH - Price sits below the death-crossed SMA50/SMA200 and the newly crossed-down EMAs, with a fresh bearish MACD crossover, −DI well above +DI and CMF in distribution. The RSI bounce and proximity to the lower band limit the downside to a modest drift toward $40.30.
This is educational analysis and not financial advice.