BE 1-day bullish forecast — Nov 1, 2026
- Bias: Bullish
- Timeframe: 1 day (made Nov 1, 2026, target date Nov 2, 2026)
- Price at analysis: $203.15
- Price target: $204.50
- Expected range: $201.20 – $207.40
- Result: Incorrect (-3.4%) — closed at $196.25 on Nov 2, 2026; quality score 0/100
Get a free AI analysis of BE today
Analysis
TECHNICAL INDICATORS
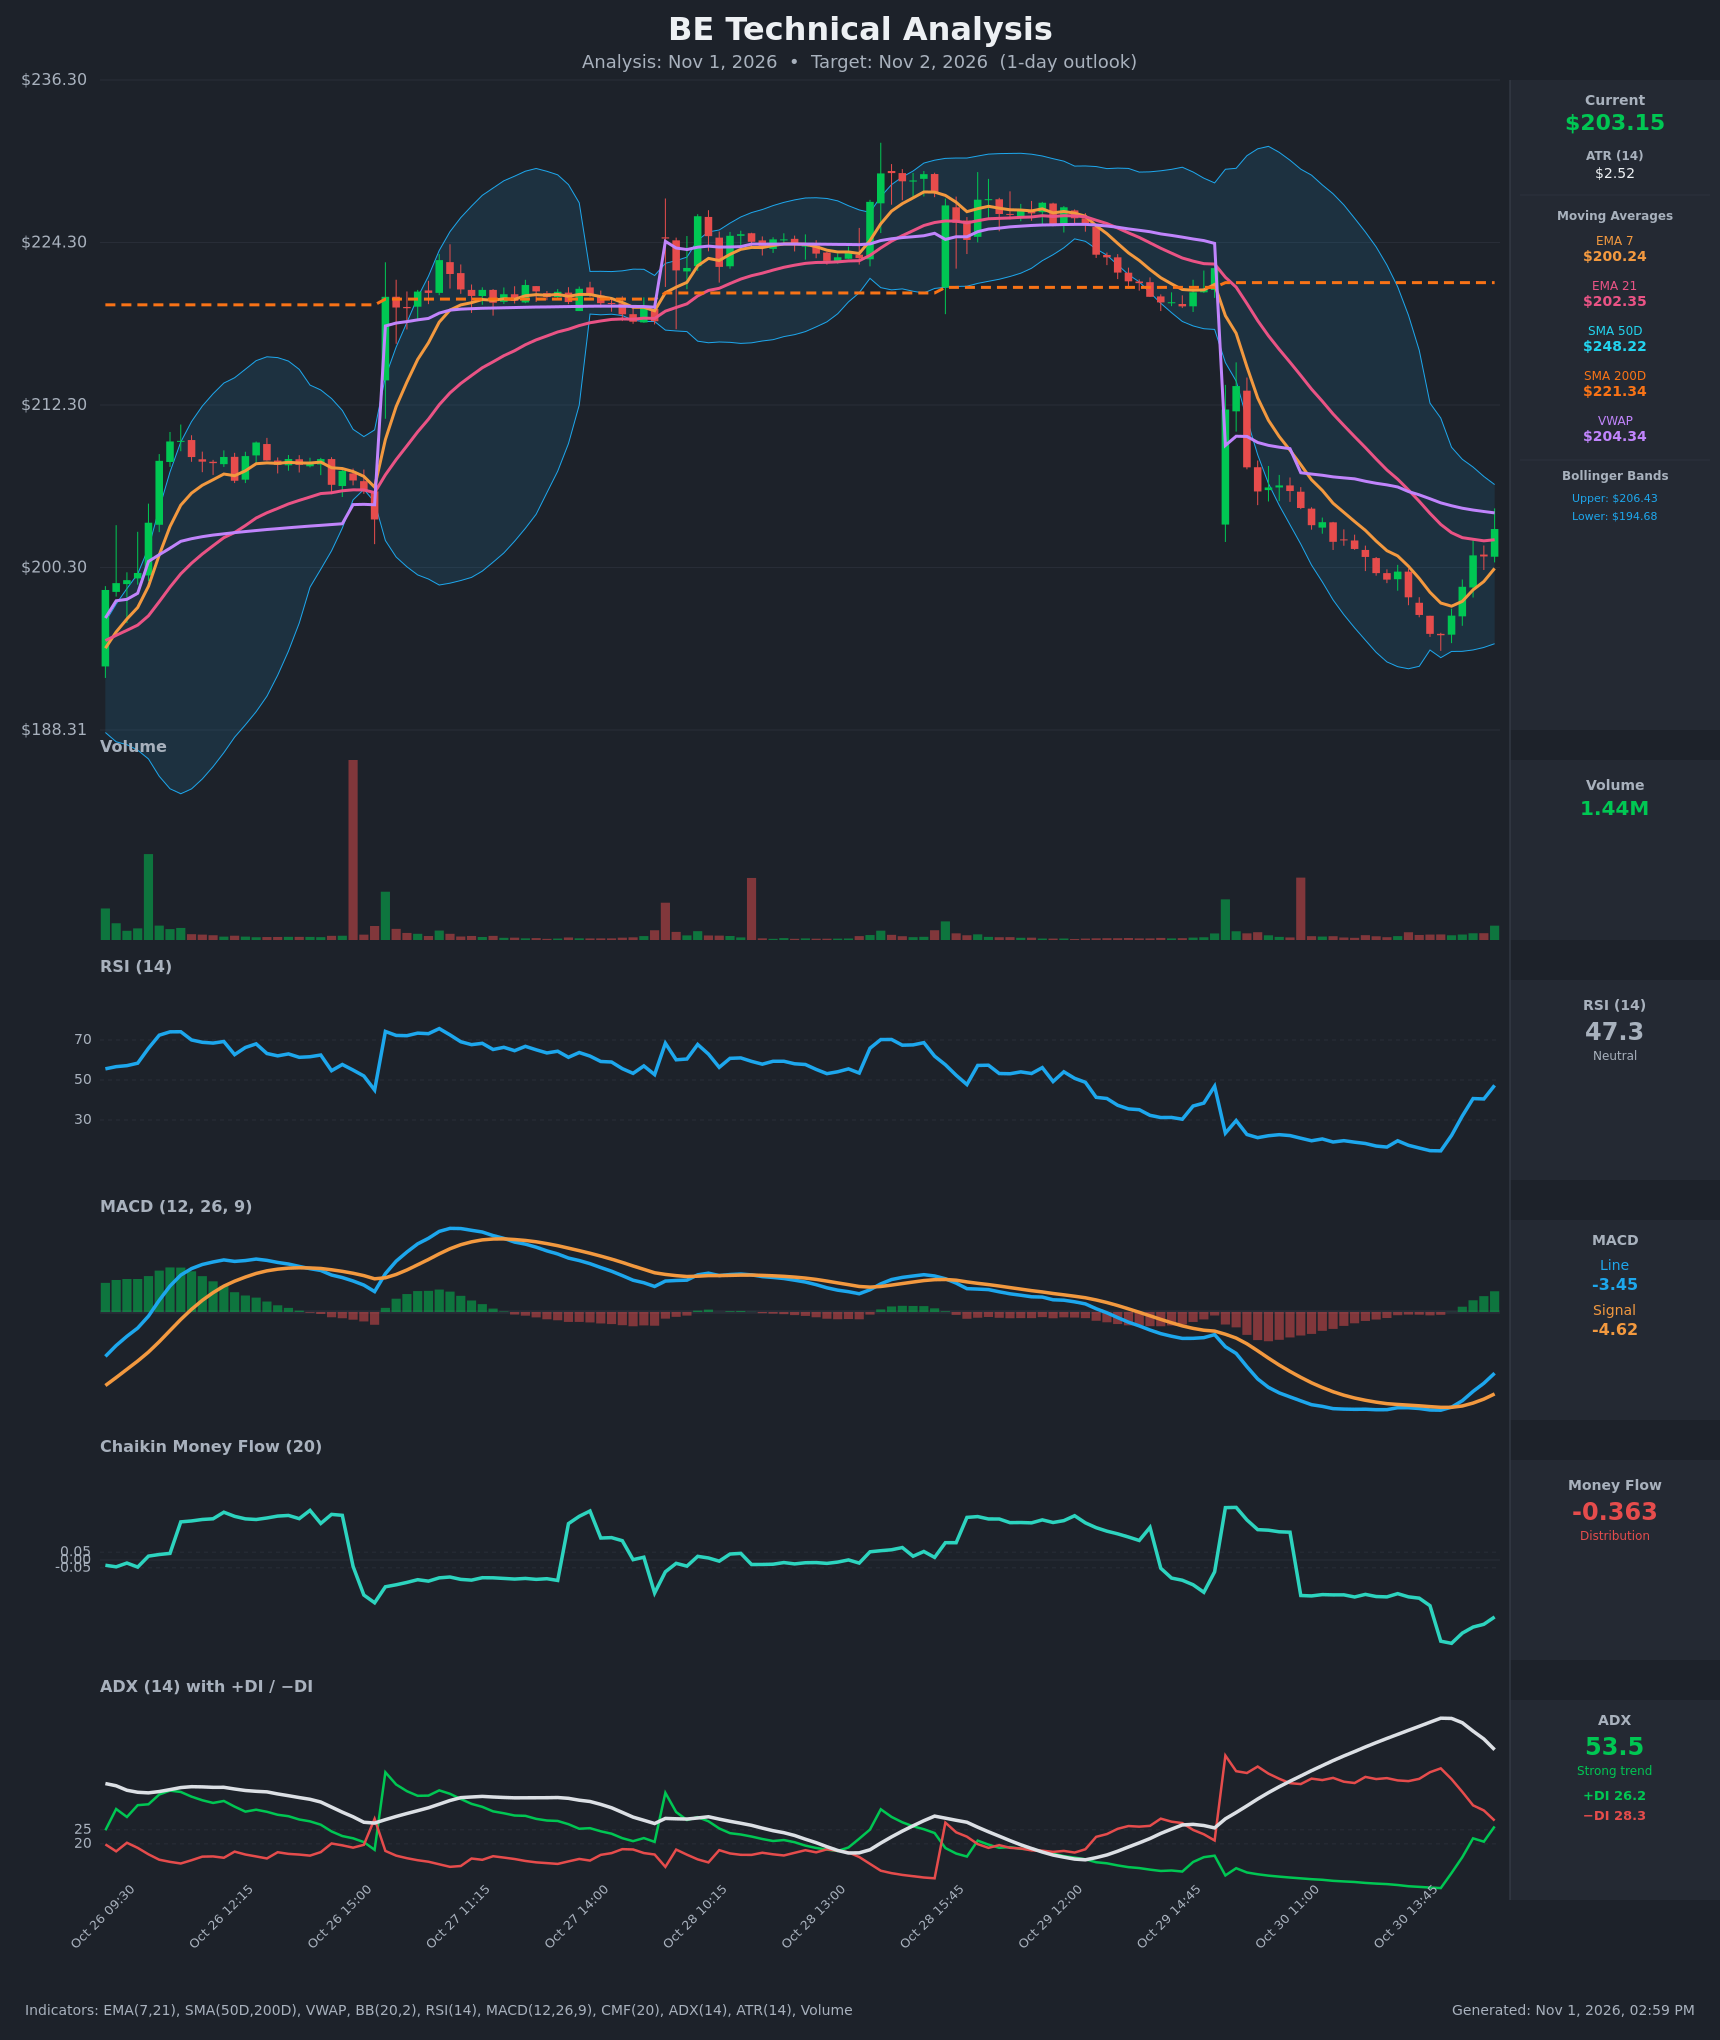
- RSI (14): 47.32, up sharply from a deeply oversold 14.6 about 12 bars ago. It is back near the 50 midline, so downside momentum has been wiped out, though it hasn't yet confirmed bullish momentum above 50. [Bullish]
- 20 EMA: EMA 7 is $200.24 and EMA 21 is $202.35. Price at $203.15 has reclaimed both, and EMA 7 is rising steeply toward EMA 21 (a bullish cross is close). Price is still far below the SMA 50 ($248.22) and SMA 200 ($221.34), which cap any larger recovery. [Bullish]
- MACD: The line (-3.45) crossed above the signal (-4.62) and the histogram is positive and expanding (about +1.17). The crossover is a fresh bullish signal, but it is happening deep below zero, so it is a relief bounce rather than a trend change. [Bullish]
- Bollinger Bands (20): Upper $206.43, lower $194.68, midline about $200.55. Price bounced off the lower band (~$195.30) and is now in the upper half, about $3.3 below the upper band. The bands are still wide after the selloff, so there is room to run, but the walk-down was strong. [Bullish]
- CMF (20): -0.363, well below -0.05. It has improved slightly from the -0.53 low but still shows heavy distribution, so the bounce lacks volume-backed accumulation. [Distribution]
- ADX (14): 53.5, extremely strong but rolling over from a peak of 64.7. -DI (28.3) is still just above +DI (26.2), but the gap has narrowed from about 40 points to 2. A +DI/−DI bullish crossover is imminent. The strong prior trend was bearish and is now exhausting. [Strong Trend, fading bearish / DI crossover pending]
- Volume: 1.44M on the latest green bar, the highest in the recent decline phase. Rising volume on the bounce supports the reversal, but it is not yet a capitulation-sized spike. VWAP ($204.34) sits just overhead as the first resistance. [Mildly Bullish]
DIVERGENCES & TRENDS
- The RSI made an extreme low (14.6) while price made its low at $195.30. The subsequent V-shaped RSI rebound confirms a momentum reversal, though it is not a classic divergence.
- The MACD line stopped making new lows (flat around -5.5) before price bottomed, a mild bullish momentum divergence that ended in the bullish crossover.
- The ADX peak and decline together with the converging DI lines show the selling trend losing force. A +DI cross above −DI would be the next confirmation.
- EMA 7 crossed back above the price-lag zone and is about to challenge EMA 21. The bullish EMA cross is not yet complete.
- Price is below VWAP, SMA 50 and SMA 200. The SMA 50 is far below... correction: it sits far above price, which keeps the larger trend bearish (the 50-day SMA ($248) is above the 200-day ($221), so no death cross, but price is well below both).
- CMF remains deeply negative, which is a bearish divergence against the bounce and a warning of weak follow-through.
CHART PATTERNS
- The sharp gap-down followed by a steady descending channel resembles a Bullish Falling Wedge, and price has now broken above the upper trendline with a V-shaped reversal. The measured target is a retrace of part of the wedge, roughly to $205-$207 (the VWAP/upper Bollinger zone).
- The larger structure is a rounded top and breakdown from the ~$225 area, with a sharp gap down. This is a bearish backdrop, and the current move is best read as a counter-trend bounce.
- No completed reversal pattern (double bottom or head and shoulders) is visible on this timeframe. A single-bar V-bottom needs a base to confirm.
POTENTIAL SCENARIOS
- Scenario 1: Bullish Relief Extension — The MACD cross, the EMA reclaim and the pending +DI/−DI cross carry price through VWAP toward the upper Bollinger Band. Trigger: Break and hold above VWAP at $204.34. Target: $206.00-$207.40. Invalidation: Close back below EMA 21 at $202.35, and especially below EMA 7 at $200.24. (50% probability)
- Scenario 2: Bearish Rejection at VWAP — The bounce stalls under VWAP with CMF still in distribution, and sellers resume the dominant downtrend. Trigger: Rejection at $204-$205 and a loss of $202.35. Target: $199.50-$200.00, with a retest of $195.30 if sellers press. Invalidation: Sustained trade above $205. (35% probability)
- Scenario 3: Neutral Chop Under VWAP — Price consolidates between EMA 7 and VWAP after the sharp V-bounce. Trigger: Low-volume drift between $201.50 and $204.50. Target: $202.50-$204.00. Invalidation: Break of either $200.24 or $206.43. (15% probability)
PRICE TARGETS
- Target Price: $204.50 (1-day horizon)
- Expected Range: $201.20 to $207.40 (width $6.20, about 3.1% of current price, consistent with the 1-day / 2-4% guidance and about 2.5x ATR)
- Key Levels: Support at $200.24 (EMA 7), Resistance at $206.43 (Bollinger upper band). VWAP at $204.34 is the first hurdle.
OVERALL BIAS
OVERALL BIAS: BULLISH - Momentum has reversed from deeply oversold. The MACD has crossed bullishly, price has reclaimed EMA 7 and EMA 21 on rising volume, and the DI lines are converging. Heavy negative CMF and the overhead VWAP/SMA resistance limit conviction, so the expected upside is modest.
This is educational analysis and not financial advice.