BE 42-day bearish forecast — Nov 9, 2026
- Bias: Bearish
- Timeframe: 42 days (made Nov 9, 2026, target date Dec 21, 2026)
- Price at analysis: $196.72
- Price target: $183.00
- Expected range: $167.00 – $201.00
- Result: Pending — graded after the close on Dec 21, 2026
Get a free AI analysis of BE today
Analysis
TECHNICAL INDICATORS
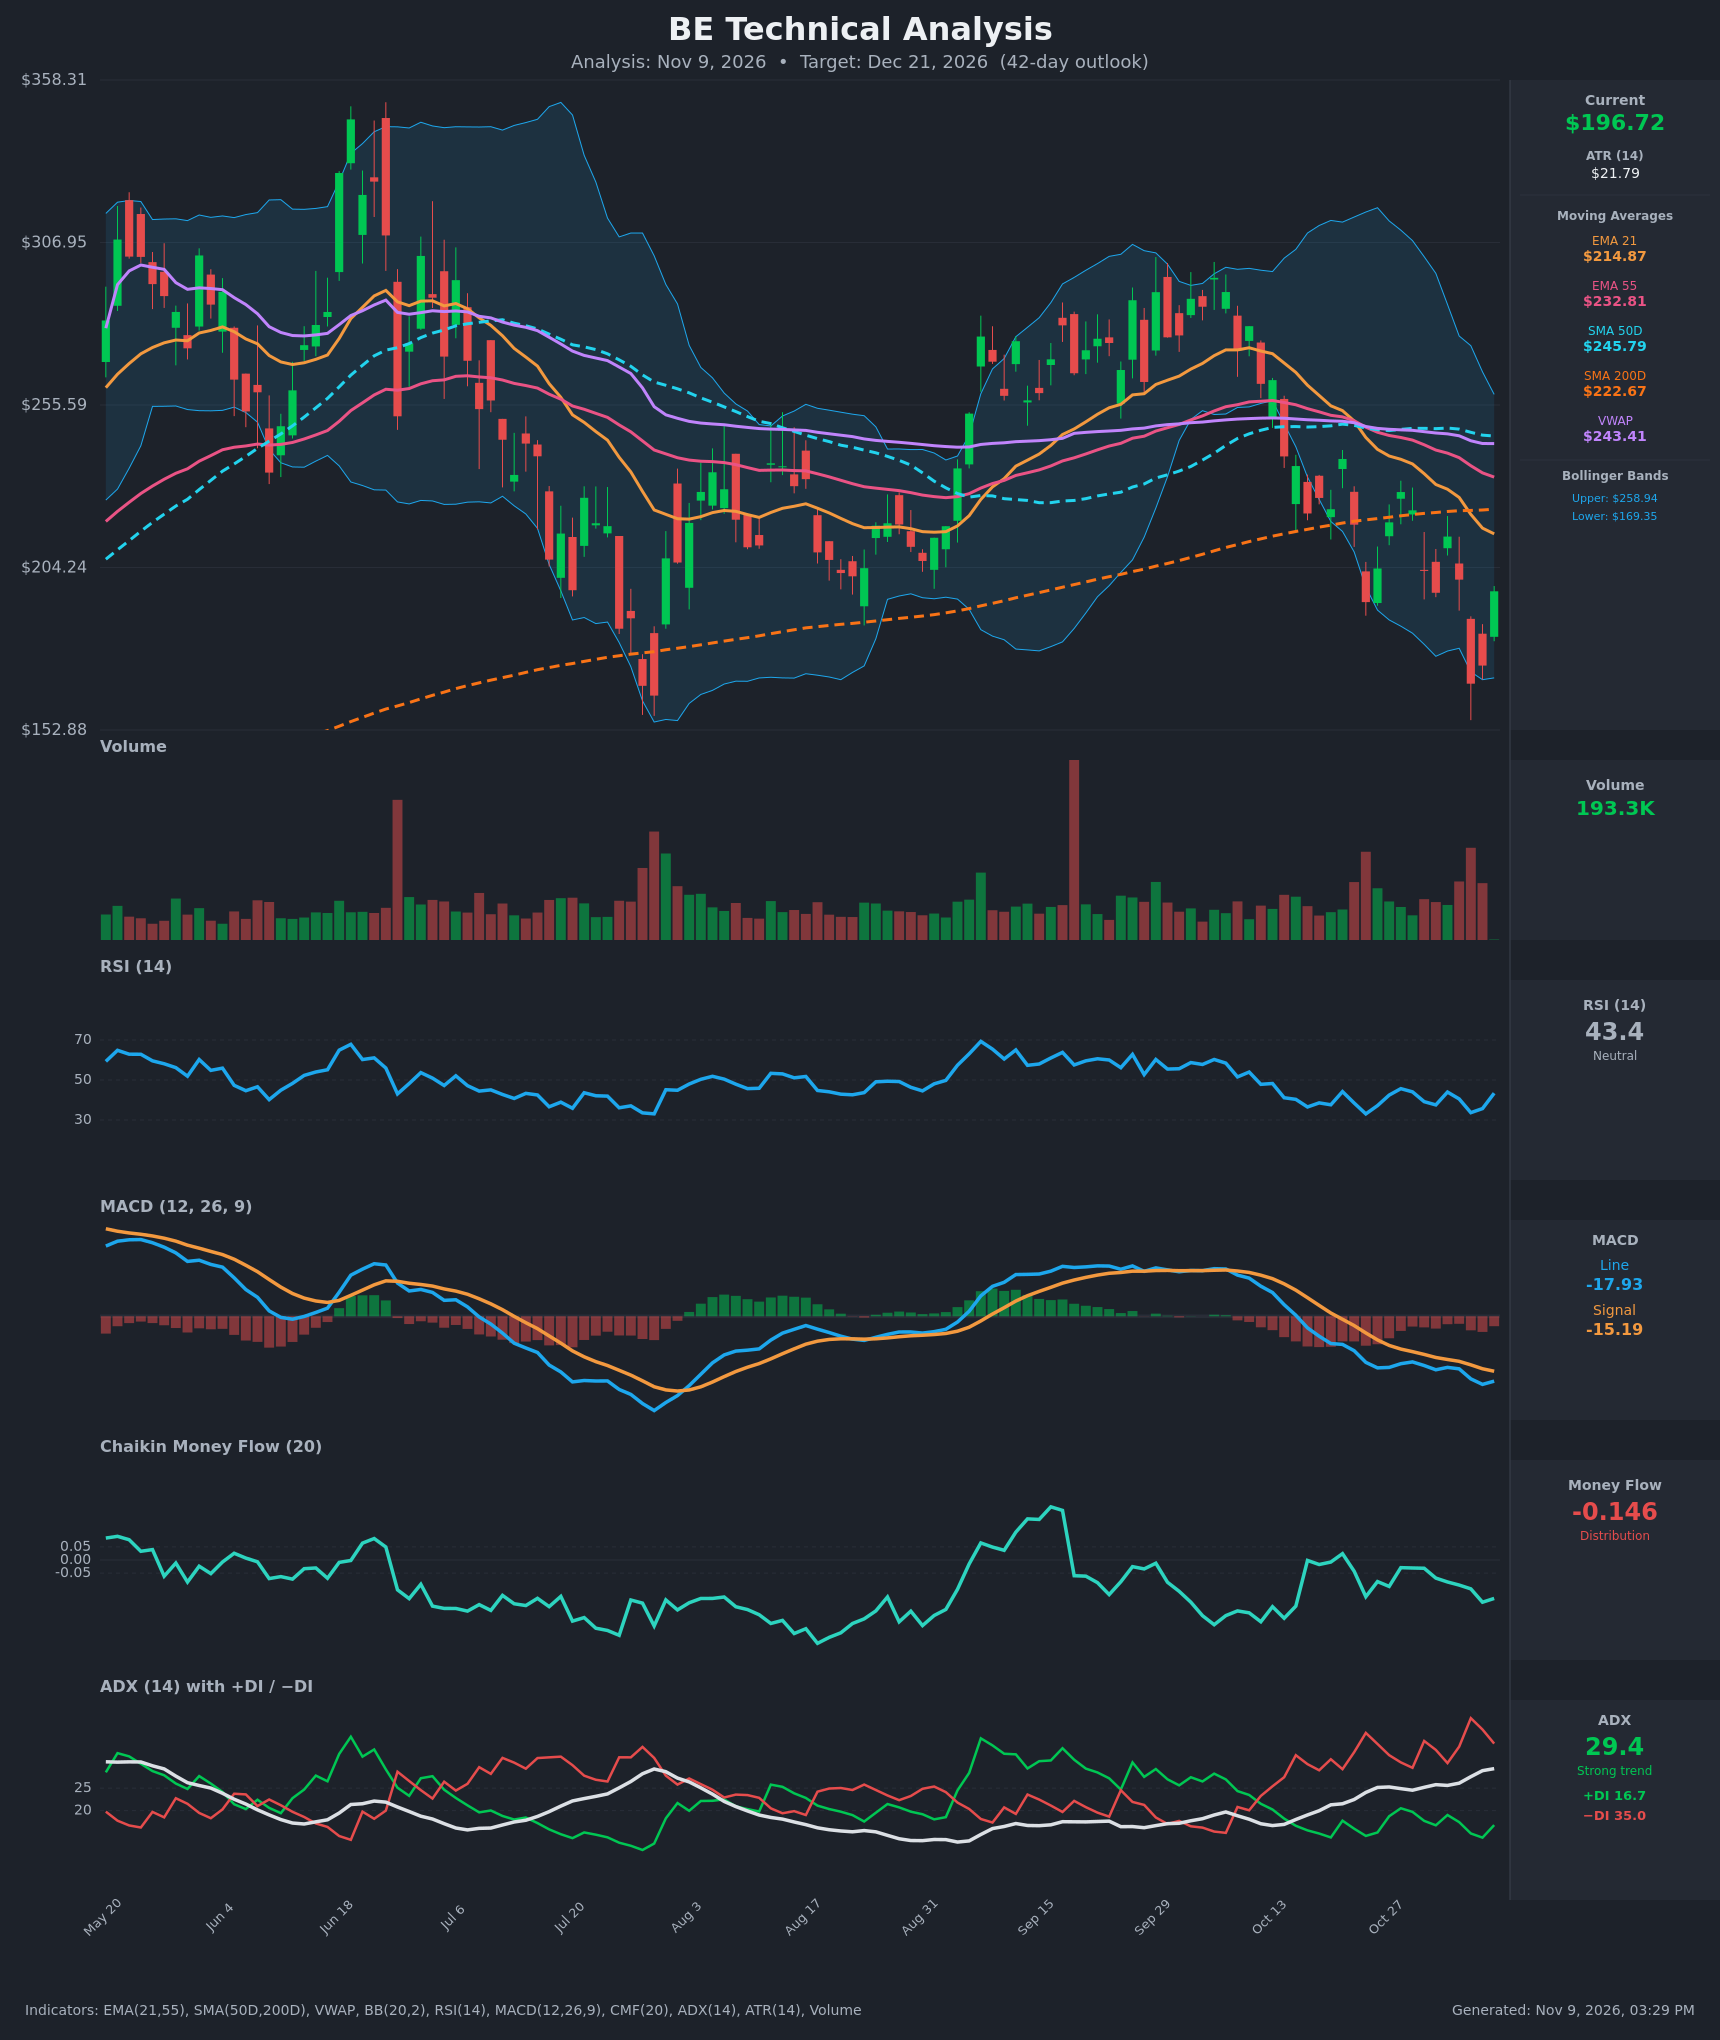
- RSI (14): 43.4, in neutral territory below 50. It bounced from 33.7 (Nov 5) as price recovered from $167.52. RSI has been capped under 46 since Oct 20, so rallies are failing at lower RSI highs. [Bearish]
- 20 EMA: The 21 EMA is $214.87 and price ($196.72) sits about 8% below it. The EMA is falling steeply (from $255 on Oct 20) and acts as overhead resistance. [Bearish]
- MACD: The line (-17.93) is below the signal (-15.19), both are well below zero, and the histogram is negative. The line made a new low on Nov 6, and the bearish crossover from late October is still intact. [Bearish]
- Bollinger Bands (20): The bands run $169.35 to $258.94, so price is in the lower half, below the midline of about $214. The Nov 5 close at $167.52 pierced the lower band and snapped back. The wide bands show high volatility, and the band-walk lower is still in place. [Bearish]
- CMF (20): -0.146, well below the -0.05 threshold. It has been negative for most of the past 3 months, with brief positive readings only in mid-Sep and early Oct. Distribution is persistent. [Distribution]
- ADX (14): 29.4 and rising (from 21 on Oct 20), with -DI at 35.0 well above +DI at 16.7. That is a strong, strengthening downtrend, with bears clearly in control. [Strong Trend - Bearish]
- Volume: 193.3K on the latest bar, a modest bounce-day print. Sell-offs (Oct 22-23, Nov 5) came on elevated red volume, while the Nov 9 green candle came on lighter volume, so the bounce lacks strong conviction. [Bearish bias, weak relief bounce]
DIVERGENCES & TRENDS
- Moving average stack: EMA21 ($214.87) < EMA55 ($232.81) < SMA50D ($245.79), and all are falling. Price is below every one of them and below VWAP ($243.41). The EMA21 crossed below the EMA55 on Oct 22, a bearish crossover.
- SMA200D: Price closed below the SMA200D ($222.67) in late October and has not reclaimed it. The SMA50D is still above the SMA200D, but the gap is narrowing ($245.79 vs. $222.67). A death cross is possible within the 42-day window if weakness persists.
- Mild bullish divergence: RSI's Nov 5 low (33.7) is roughly equal to its Oct 23 low (33.1), while price made a much lower low ($167.52 vs. $193.30). This suggests selling exhaustion, and it is the main support for a relief bounce.
- MACD and DI confirm the downtrend: MACD hit new lows on Nov 6 and −DI has been above +DI for the entire recent period. These do not support a bullish reversal yet.
- CMF: It has made no higher low and shows no accumulation, so the bounce is not backed by buying flow.
- Price structure: The stock has made a series of lower highs since the early-Oct peak near $300, and the Nov 9 +13.5% bounce is a reaction rally into broken support.
CHART PATTERNS
- Bearish continuation / descending channel (closest to the Bearish Flag/Pennant family): After the sharp drop from about $290 to the $195 area, price is forming lower highs and lower lows. A rejection near the EMA21/SMA200D zone ($215-$223) would confirm continuation toward the lower band and the $167.52 low. A measured move of the prior leg points well below $167.
- Possible failed-support structure: The loss of the SMA200D, now acting as resistance, is a bearish breakdown retest.
- Counter-pattern (low confidence): The Nov 5 undercut of the lower band with a sharp reversal resembles a Bullish Falling Wedge or Double Bottom attempt. It would need a close above $214.87 to be validated, which is not yet in evidence.
POTENTIAL SCENARIOS
- Scenario 1: Bearish Continuation Lower — The relief bounce stalls under the EMA21/SMA200D zone and sellers push price back to retest the Nov 5 low. ADX above 25, −DI dominance and negative CMF support this. Trigger: rejection at $205-$215 or a close below $190. Target: $175 first, then $165-$170 (lower band and Nov 5 low). Invalidation: daily close above $223 (SMA200D reclaimed) with MACD histogram turning up. (52% probability)
- Scenario 2: Bullish Relief Rally / Base Formation — The RSI divergence and the lower-band bounce lead to a bigger mean-reversion rally. Trigger: close above $214.87 (EMA21) on rising volume with CMF moving back above 0. Target: $222-$232 (SMA200D, then EMA55). Invalidation: close below $185 or a new low under $167.50. (30% probability)
- Scenario 3: Neutral Choppy Range — Price consolidates between about $170 and $215 as volatility compresses. Trigger: failure to break either the $167.50 low or the $214.87 EMA21. Target: $185-$205. Invalidation: decisive break outside the range on volume. (18% probability)
PRICE TARGETS
- Target Price: $183.00 (42-day, around Dec 21, 2026)
- Expected Range: $167.00 to $201.00 (width $34 ≈ 17.3% of the $196.72 current price, consistent with the 30-60 day guidance of 12-18%)
- Key Levels: Support at $167.52, Resistance at $214.87
Self-check: the range is $34 wide, about 17.3% of the current price. That sits within the 12-18% band for this timeframe and is much wider than a 2-3 day range. The target is below the current price, consistent with a bearish bias.
OVERALL BIAS
OVERALL BIAS: BEARISH - Price is below the EMA21, EMA55, SMA50D, SMA200D and VWAP, MACD is negative and below its signal, CMF shows persistent distribution, and ADX 29.4 with −DI 35 vs. +DI 16.7 signals a strong downtrend. The mild RSI bullish divergence only argues for a relief bounce, which should face heavy resistance at $215-$223.
This is educational analysis and not financial advice.