BE 46-day bearish forecast — Nov 5, 2026
- Bias: Bearish
- Timeframe: 46 days (made Nov 5, 2026, target date Dec 21, 2026)
- Price at analysis: $170.39
- Price target: $158.00
- Expected range: $144.00 – $176.00
- Result: Pending — graded after the close on Dec 21, 2026
Get a free AI analysis of BE today
Analysis
TECHNICAL INDICATORS
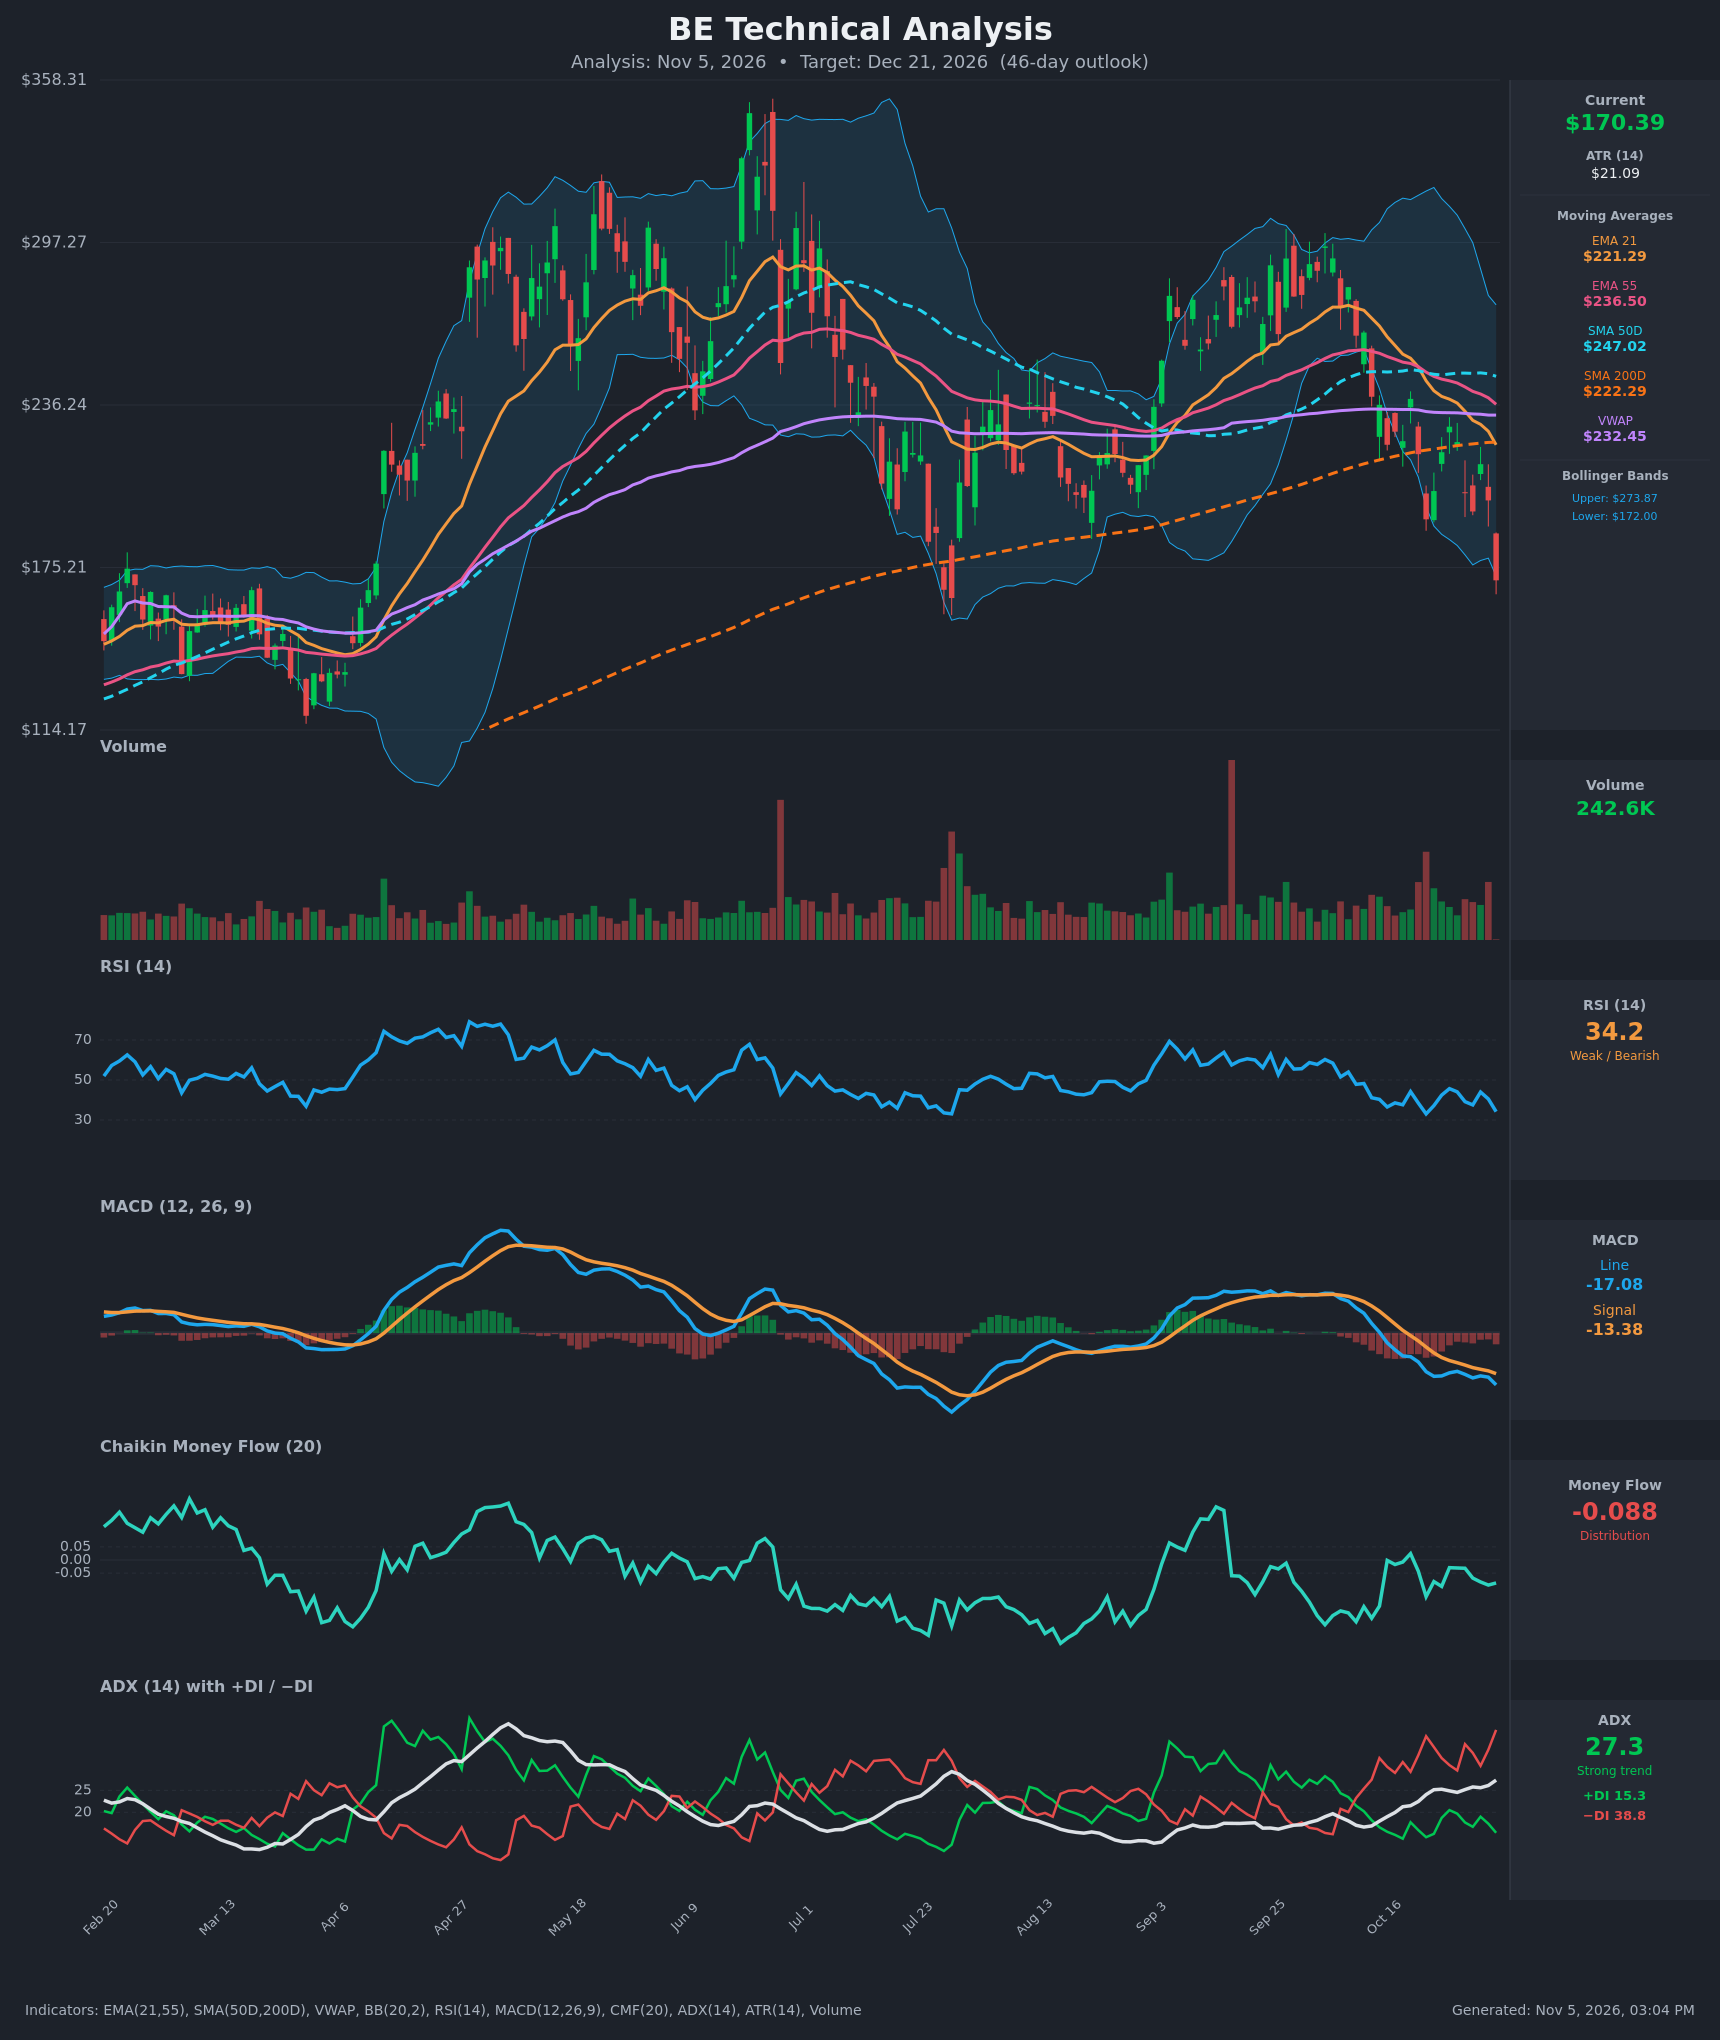
- RSI (14): 34.18, falling from 44 on Nov 3 and approaching oversold (<30) without being there yet. Momentum is clearly down, and RSI has made lower highs since the Oct 28 bounce (45.7). [Bearish]
- 20 EMA (EMA 21): $221.29, with price ($170.39) about 23% below it. The EMA is sloping down and has been acting as resistance on every bounce. EMA 21 is also below EMA 55 ($236.50), a bearish alignment. [Bearish]
- MACD: Line -17.08 is below Signal -13.38, and the gap widened over the last 3 bars. Both are below zero, and the histogram is negative and expanding. The last bullish crossover failed, and the bearish cross has persisted since about Oct 21. [Bearish]
- Bollinger Bands (20): Upper $273.87, lower $172.00. Price at $170.39 closed just below the lower band after a roughly 15% single-day drop. This is a stretched, oversold reading that can produce a snap-back, but in a strong trend price can "walk the band". The bands remain wide, so volatility is elevated. [Bearish]
- CMF (20): -0.088, below the -0.05 threshold. It has been negative or flat for weeks and dipped to -0.14 on Oct 23, so selling pressure keeps showing up and there is no accumulation. [Distribution]
- ADX (14): 27.3 and rising, with -DI (38.8) far above +DI (15.3). The trend is strong and bearish, and the DI spread of about 23.5 points is widening. [Strong Trend – Bearish]
- Volume: 242.6K on the latest red bar, among the heavier prints of the recent period. A large down candle on rising volume signals decisive selling or capitulation rather than a quiet drift. [Bearish – confirming the breakdown]
DIVERGENCES & TRENDS
- There is no bullish divergence yet. RSI (34) and MACD are making new lows in step with price, which confirms the decline.
- Moving averages are stacked bearishly. Price ($170.39) is below VWAP ($232.45), EMA 21, EMA 55, SMA 50D ($247.02) and, importantly, SMA 200D ($222.29). This is the first sustained break below the 200D since the April uptrend.
- The SMA 50D is still above the SMA 200D, so no death cross has formed. The 50D is flattening and rolling over, though, so a cross is possible in the coming months.
- EMA 21 crossed below EMA 55 in late October (the table shows EMA 21 below EMA 55 since Oct 22). This is a bearish crossover.
- Price lost the Sep–Oct range (lows near $196–$200) with a gap-like drop on Nov 5. The most recent lower highs are $238 (Oct 21), $228 (Oct 28) and $214 (Nov 3).
- ADX has risen from about 19 to 27 over 15 bars while -DI dominates, so the trend is strengthening to the downside.
- The MACD histogram is extending lower, with no sign of momentum exhaustion.
CHART PATTERNS
- Possible large Bearish Head and Shoulders (loose): The April–May highs (~$300), the June peak (~$350, the head) and the September highs (~$300) form a rough left shoulder, head and right shoulder. The neckline area is the July trough near $157. A decisive break below it would project a move far below, but this is a loose fit and the neckline has not yet been tested.
- Lower-high descending structure / bearish continuation: The sequence of lower highs since late September, plus a sharp break below the prior range floor (~$196), resembles a bearish breakdown with a measured target near the next major support, $155–$160.
- The Bollinger lower-band close and RSI in the mid-30s raise the odds of a short-term relief bounce before the next leg lower. A bounce into the $195–$205 breakdown zone would likely be a retest.
POTENTIAL SCENARIOS
- Scenario 1: Bearish Trend Continuation to July Lows — Strong ADX, -DI dominance, a negative MACD and distribution flow suggest sellers remain in control. After a possible short bounce, price grinds toward the July trough. Trigger: close below $165 or failed bounce at $195–$205. Target: $155–$160, with an extension to $145 on a break of $157. Invalidation: daily close above $205, which reclaims the breakdown zone. (55% probability)
- Scenario 2: Bullish Oversold Relief Rally — Price closed below the lower Bollinger Band after a capitulation-style drop on heavy volume, which often leads to a mean-reversion bounce toward the EMA 21. Trigger: RSI turning up from 30 and a close back above $185. Target: $200–$215. Invalidation: rejection at $200 followed by a break below $165. (25% probability)
- Scenario 3: Neutral Base Building — Price chops between $155 and $195 as selling exhausts but buyers stay hesitant. Trigger: low-volume consolidation holding $160. Target: $165–$180. Invalidation: close below $155 or above $200. (20% probability)
PRICE TARGETS
For the 46-day timeframe (to about Dec 21, 2026):
- Target Price: $158.00
- Expected Range: $144.00 to $176.00 (width $32 = about 18.8% of current price, consistent with the 30–60 day guidance)
- Key Levels: Support at $157.00 (July trough), Resistance at $200.00 (prior breakdown zone / Nov 4 close)
OVERALL BIAS
OVERALL BIAS: BEARISH - Price is below every major moving average, including the SMA 200D. MACD is bearish and widening, ADX is above 25 with -DI far above +DI, and CMF shows distribution on heavy-volume selling. An oversold bounce is possible, but the path of least resistance is toward the $155–$160 July low.
This is educational analysis and not financial advice.