BE 72-day bearish forecast — Nov 5, 2026
- Bias: Bearish
- Timeframe: 72 days (made Nov 5, 2026, target date Jan 15, 2027)
- Price at analysis: $167.49
- Price target: $158.00
- Expected range: $136.00 – $188.00
- Result: Pending — graded after the close on Jan 15, 2027
Get a free AI analysis of BE today
Analysis
TECHNICAL INDICATORS
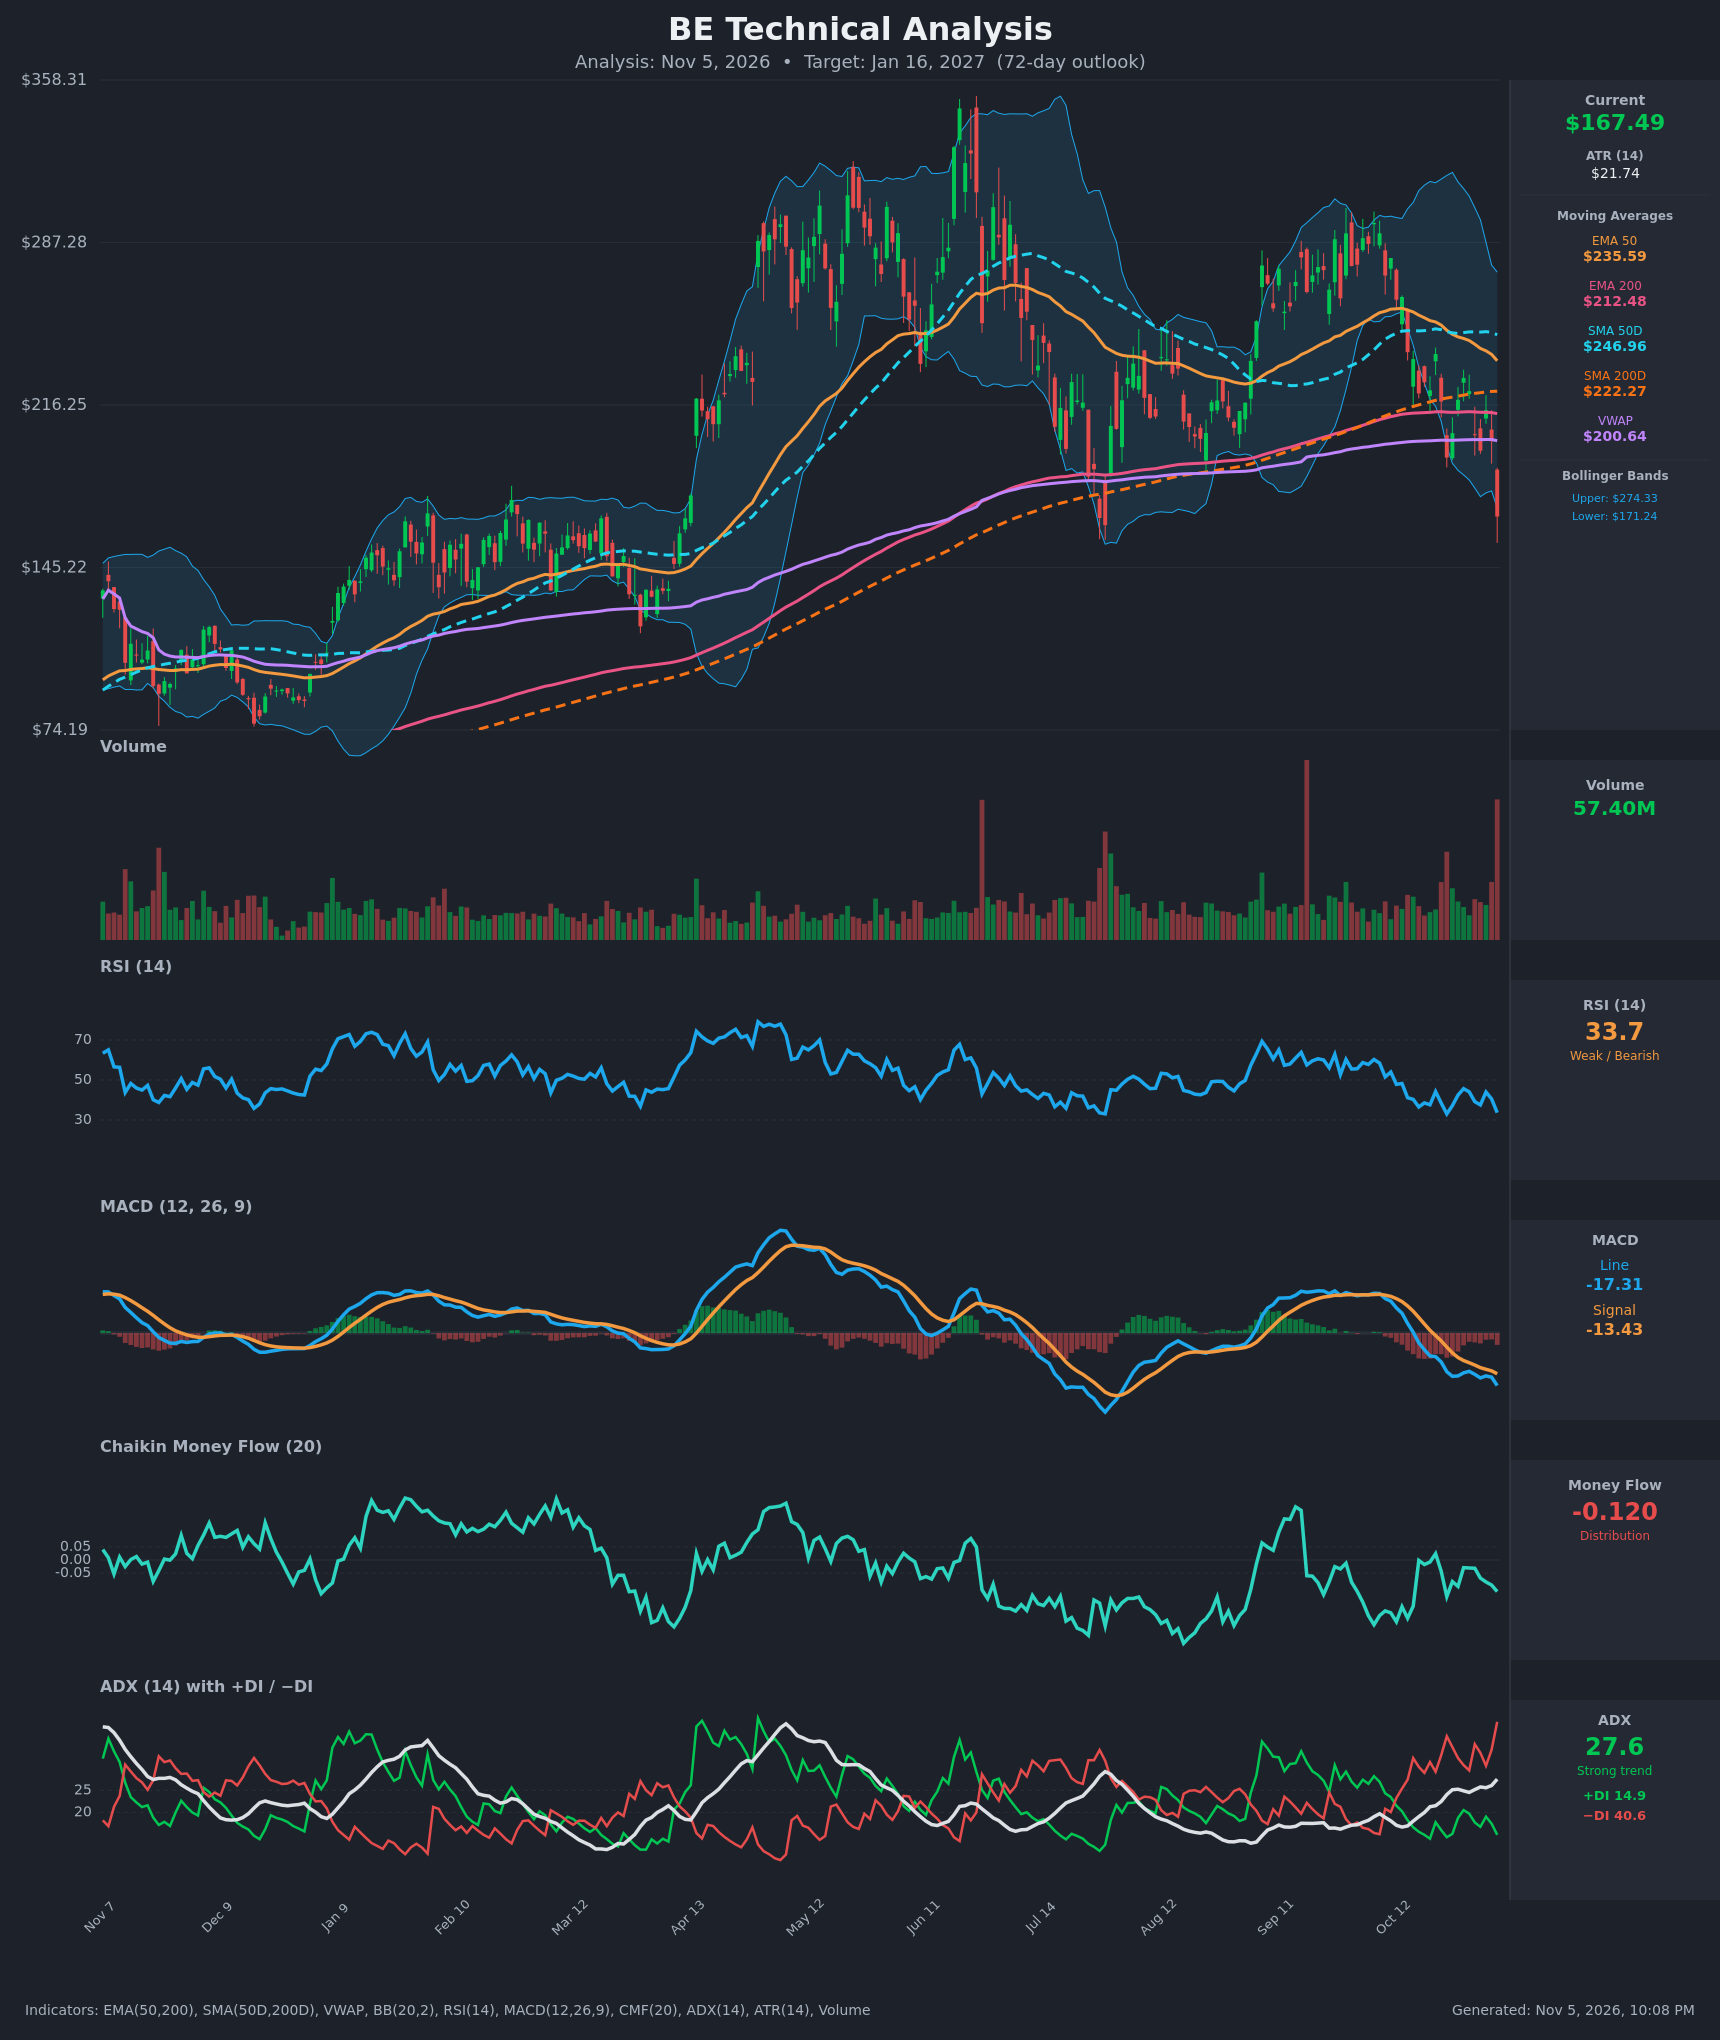
- RSI (14): 33.67, just above the oversold line at 30. It fell from 44 on Nov 3 and is making lower lows, so momentum is still pointing down. There is no bullish reversal signal yet. [Bearish]
- 20 EMA: The 20 EMA isn't supplied, so I used the EMA 50 at $235.59, with price about 29% below it and the EMA sloping down from $255.52 on Oct 16. EMA 200 is $212.48 and price has also lost that long-term line. Both are now overhead resistance. [Bearish]
- MACD: Line -17.31 is below signal -13.43 and the gap is widening, with the histogram at about -3.9. The bearish crossover occurred around Oct 21 and has deepened. [Bearish]
- Bollinger Bands (20): Price at $167.49 is below the lower band ($171.24) after a close well outside it. The bands are wide (upper $274.33), which shows high volatility. A close outside the lower band in a strong downtrend often signals trend continuation ("walking the band"), though it also raises the odds of a short-term snap-back toward the mid-band (about $222). [Bearish]
- CMF (20): -0.120, well below -0.05 and at its lowest since Oct 23 (-0.140). Persistent distribution. [Distribution]
- ADX (14): 27.6 and rising (from 19 on Oct 16), with -DI at 40.6 far above +DI at 14.9. This is a strong, accelerating downtrend with bears firmly in control. [Strong Trend – Bearish]
- Volume: 57.40M, the highest bar on the recent chart and one of the largest of the year, on a roughly 16% one-day drop ($200.40 → $167.49). Heavy-volume breakdown confirms selling pressure. It could also be partial capitulation, which would make a bounce possible. [Bearish – high-volume breakdown]
DIVERGENCES & TRENDS
- There is no bullish RSI divergence. RSI made a lower low (33.7 vs 37.5 on Nov 2) alongside the lower price low, so momentum confirms the move.
- The MACD line is making new lows (-17.3) and the histogram is expanding negative. This is a bearish momentum trend.
- The price structure is lower highs since the June peak (~$350), then ~$300 in September, then ~$238 on Oct 21. EMA 50 is falling and now converges toward EMA 200.
- Price is below VWAP ($200.64), SMA 200D ($222.27), EMA 200 ($212.48), EMA 50 ($235.59) and SMA 50D ($246.96). All of these now act as resistance.
- SMA 50D ($246.96) is still above SMA 200D ($222.27), so there is no death cross yet. The gap is narrowing, and a death cross is plausible within the 72-day window if weakness persists.
- ADX rose from 19 to 27.6 and -DI spiked, so the trend is strengthening rather than exhausting.
- CMF has been negative for most of the period since June, a long-running distribution trend.
CHART PATTERNS
- Lower-high structure / failed rebound (Bearish Head and Shoulders-like): The June peak, the lower September high and the weaker October bounce form a descending sequence. The breakdown below the ~$195–200 support shelf (the late-Oct lows) completes a bearish break. The measured move points toward the $150s and below.
- Breakdown from a range: Price traded between about $195 and $240 during Oct. The break below $195 on heavy volume targets roughly the range height (~$40) below, near $155.
- Possible Bullish Double Bottom (alternate view): The July low (~$153–155) is the key test. If price retests that zone and holds with a higher RSI low, a double bottom could form, with a neckline near $200 and a measured move toward about $245. This is not confirmed, and it is the main risk to the bearish view.
POTENTIAL SCENARIOS
- Scenario 1: Bearish Continuation Toward July Lows — The high-volume breakdown, -DI dominance and negative CMF and MACD point to follow-through. Price tests the $153–155 July low and possibly wicks below it. Rallies stall at the broken $195–200 zone. Trigger: close below $160, or failure to reclaim $171. Target: $150–$158, with an extension to about $138 if $153 breaks. Invalidation: daily close above $200.64 (VWAP). (50% probability)
- Scenario 2: Bullish Relief Bounce / Double Bottom — The 16% single-day drop on record volume and price below the lower band may mark capitulation. A reflex bounce fills toward the broken zone. Trigger: reclaim of $171–175 with RSI turning up from near 30 and MACD histogram shrinking. Target: $195–$200 (VWAP and breakdown level), extension to $212 (EMA 200). Invalidation: close below $150. (35% probability)
- Scenario 3: Neutral Range Between Support and the Breakdown Level — Price chops between the $153 support and $185–195 resistance as selling exhausts. Trigger: ADX rolling over below 25 with price holding $155. Target: $160–$180. Invalidation: close outside $150–$200. (15% probability)
PRICE TARGETS
- Target Price: $158.00 (72 days, Jan 16, 2027)
- Expected Range: $136.00 to $188.00 (width $52 ≈ 31% of the current price, within the wide-range band appropriate for a 72-day horizon with ATR of $21.74)
- Key Levels: Support at $153.00 (July low), Resistance at $200.64 (VWAP and the breakdown zone)
OVERALL BIAS
OVERALL BIAS: BEARISH - A record-volume breakdown below the lower Bollinger Band and every major moving average, with -DI 40.6 against +DI 14.9, ADX rising to 27.6, a widening bearish MACD gap and CMF at -0.12. Any bounce faces heavy overhead resistance at $171–$200, and the $153 July low is the main support to watch.
This is educational analysis and not financial advice.