META 4-day bearish forecast — Nov 1, 2026
- Bias: Bearish
- Timeframe: 4 days (made Nov 1, 2026, target date Nov 4, 2026)
- Price at analysis: $614.98
- Price target: $609.00
- Expected range: $596.50 – $629.50
- Result: Incorrect (+2.7%) — closed at $631.72 on Nov 4, 2026; quality score 33/100
Get a free AI analysis of META today
Analysis
TECHNICAL INDICATORS
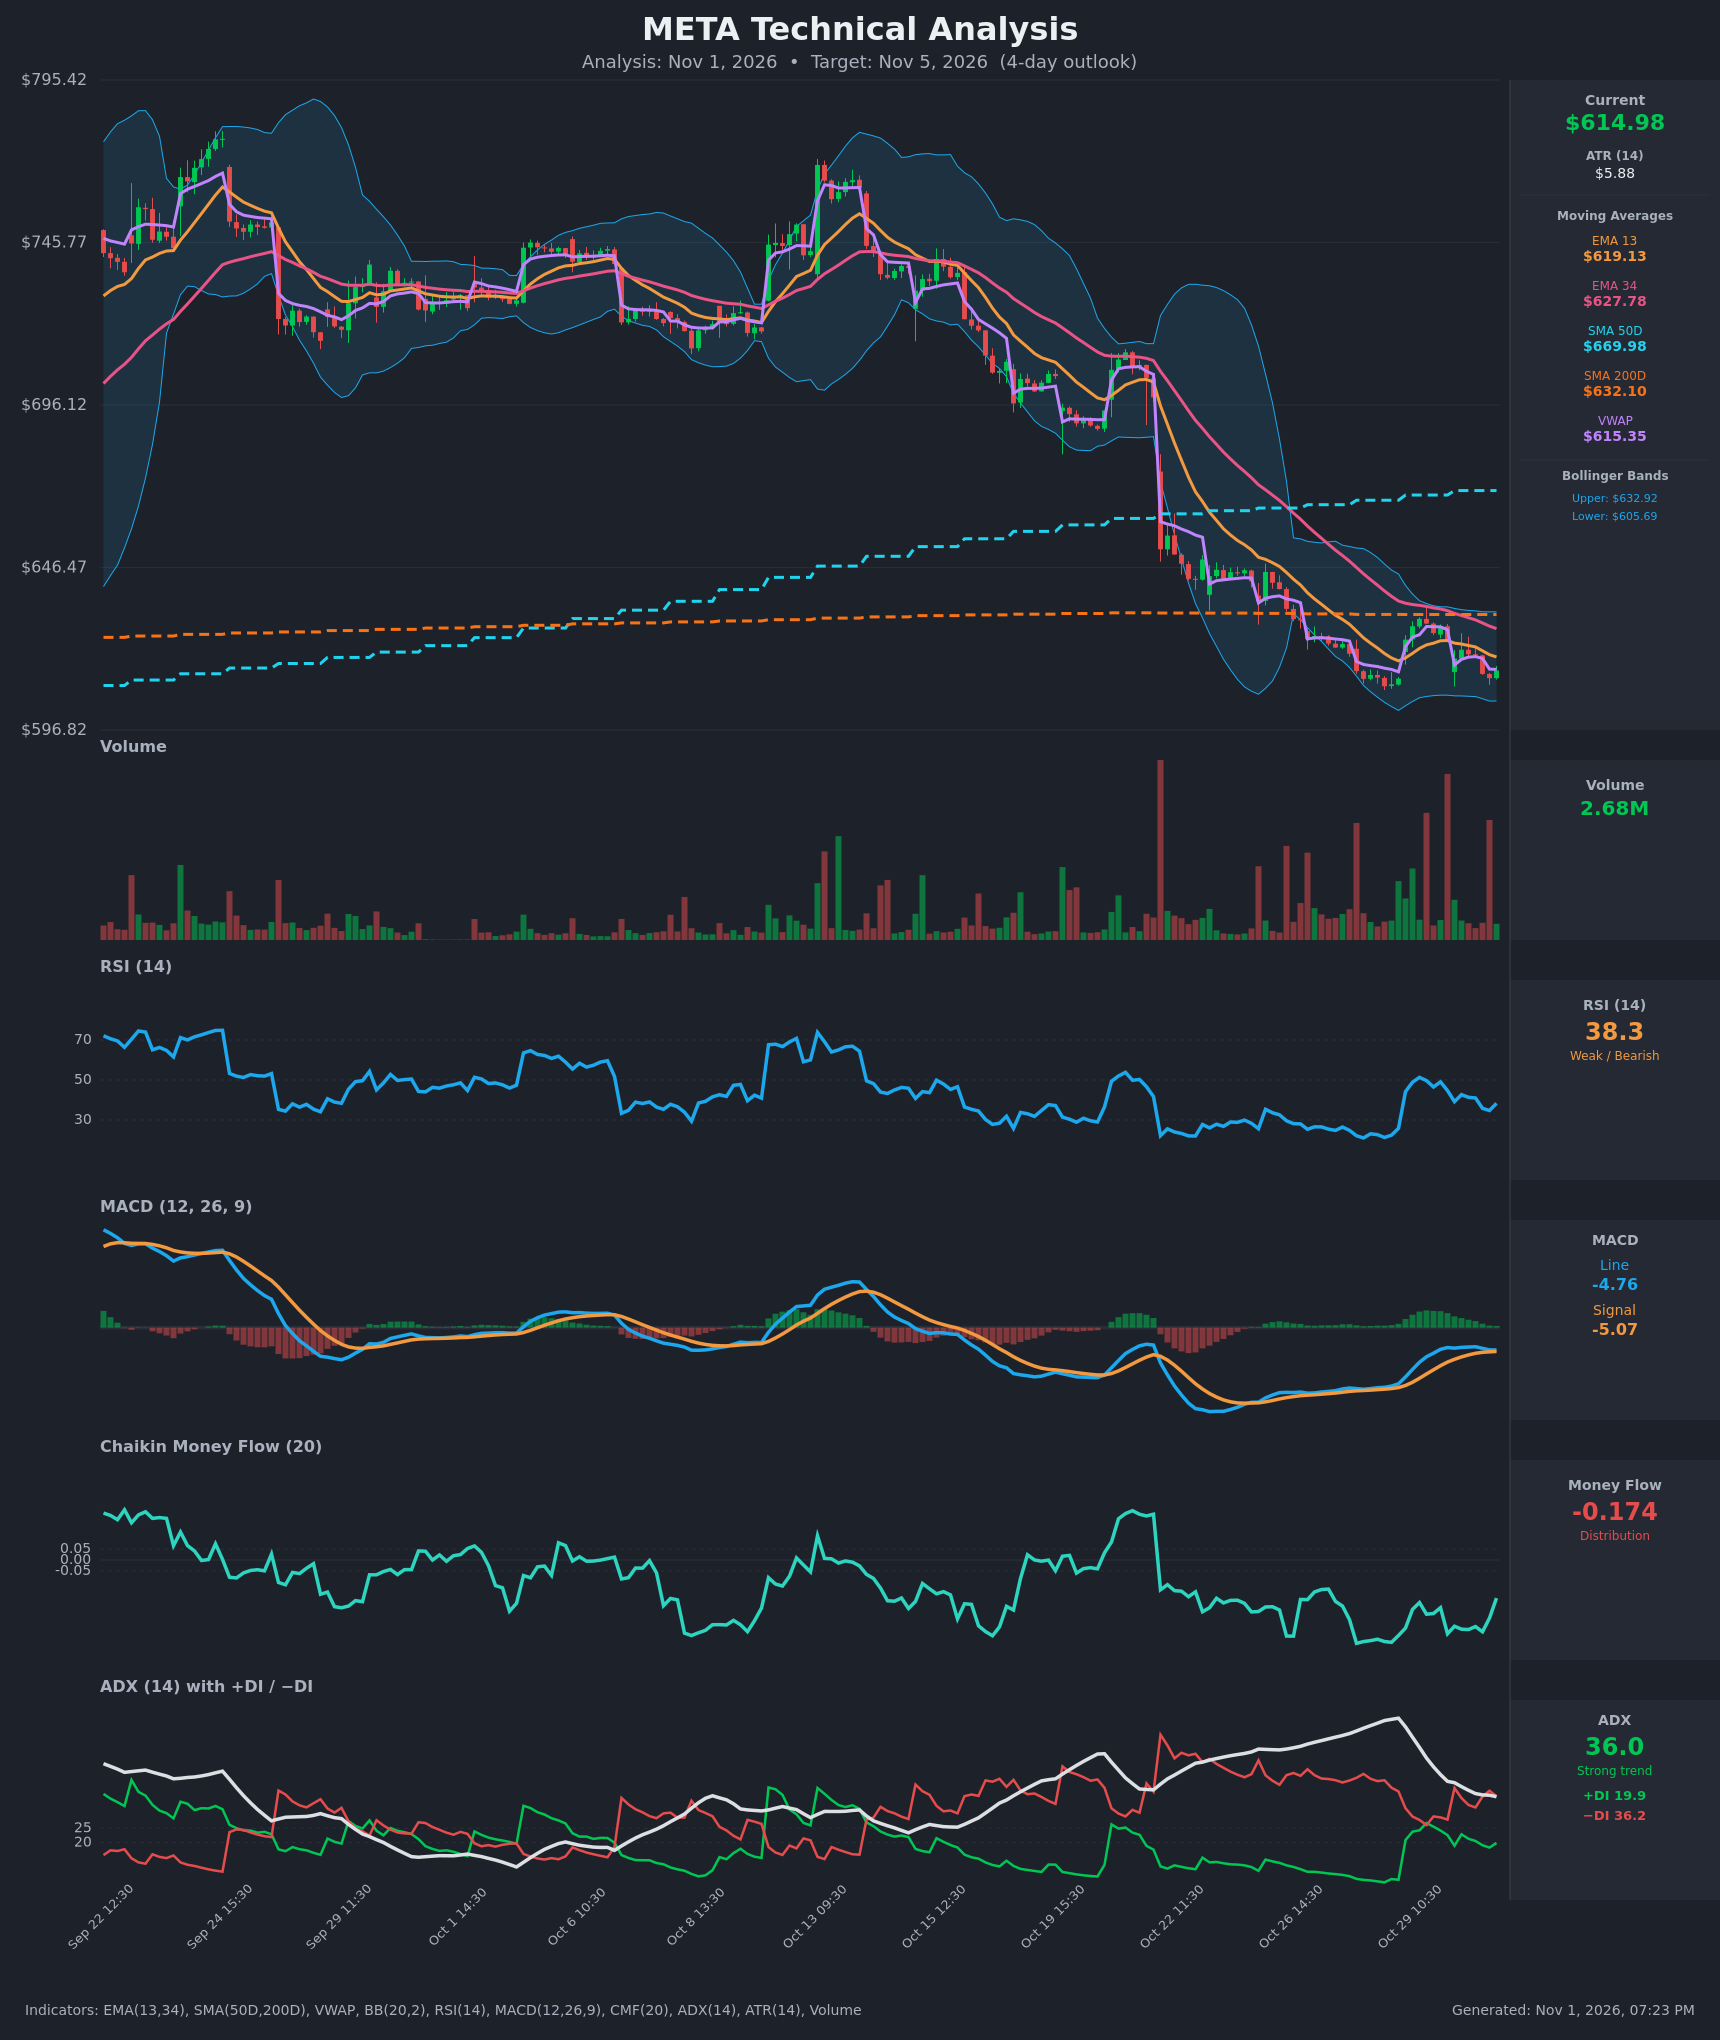
- RSI (14): 38.34, bouncing off 34.8 but still below 50. It has been stuck in a weak 25–50 band since the Oct 22 gap-down, so momentum is bearish with no oversold extreme to trigger a reversal. [Bearish]
- 20 EMA: Not shown directly. The EMA 13 is $619.13 and the EMA 34 is $627.78, and price at $614.98 is below both. EMA13 is below EMA34 and the gap is widening, so both act as overhead resistance. [Bearish]
- MACD: Line -4.756 is just below signal -5.071, but the line is above the signal by about 0.31, so the histogram is slightly positive. It is flattening and rolling over (the line fell from -4.12 to -4.76 over the last several bars), so the positive histogram is fading. Both lines sit below zero. [Bearish]
- Bollinger Bands (20): Upper $632.92, lower $605.69, midline about $619.30. Price is in the lower half of the bands, about 1.5 ATR above the lower band. The bands have contracted sharply after the big expansion, and price has been walking along the lower band. [Bearish]
- CMF (20): -0.174, well below -0.05, which means distribution. It has ticked up from -0.327 but remains clearly negative. [Distribution]
- ADX (14): 36.0, easing from a peak above 60, with −DI 36.2 on top of +DI 19.9. The trend is strong and bearish, though it is losing some intensity. [Strong Trend – Bearish]
- Volume: 2.68M. There are periodic high-volume red spikes on down moves, and the bounce volume is unremarkable. VWAP at $615.35 is almost exactly where price sits, so buyers and sellers are balanced right now. [Neutral to Bearish]
DIVERGENCES & TRENDS
- Bearish structure: Price is below EMA13, EMA34, SMA200D ($632.10) and SMA50D ($669.98). SMA50D is above SMA200D but flattening, with the price collapse pulling it down. A death cross is not in yet, but the trajectory points toward one.
- Mild bullish divergence: RSI made a higher low (34.8 on Oct 30 vs 25.8 on Oct 28) while price made a roughly equal low (about $612). This points to a short-term bounce, not a trend change.
- Failed bounce: The Oct 29 rally to $630.78 was rejected right at the EMA34 and SMA200D confluence, and price has since rolled over.
- DI behavior: −DI is still dominant at 36.2 against 19.9. ADX has fallen from above 60, which suggests the selloff is maturing and may turn into a consolidation.
- Money flow: CMF has been persistently negative since mid-October, which confirms distribution.
CHART PATTERNS
- Bearish Pennant / Flag (continuation): After the sharp drop from about $680 to $630, price has made a series of lower highs and lower lows in a tight descending channel. This fits the bearish flag/pennant better than a reversal pattern. A break below $605 (the lower BB and recent lows) projects a measured move toward $590–$595.
- Possible Bullish Falling Wedge: The converging lows and compressing range could also be read as a falling wedge. It has not been confirmed by a breakout above $620–$628, so it is a minority case.
- Key resistance: The EMA13/34 and SMA200D cluster at $619–$632.
POTENTIAL SCENARIOS
- Scenario 1: Bearish Continuation Lower — Price stays under the EMAs and SMA200D, and sellers push it into the lower Bollinger Band. Distribution (CMF -0.17) and −DI dominance keep the trend down. Trigger: break below $612 and then $605.69. Target: $600–$604. Invalidation: close above $628 (EMA34). (50% probability)
- Scenario 2: Neutral Range Chop — Price oscillates around VWAP between the lower band and EMA13 as the selloff matures and ADX fades. Trigger: failure to break $605 or $622 over the period. Target: $608–$620. Invalidation: close above $628 or below $603. (28% probability)
- Scenario 3: Bullish Relief Bounce — The mild RSI divergence and the flattening MACD histogram produce a bounce toward the EMA34 and SMA200D. Trigger: reclaim of $620 on rising volume. Target: $628–$633. Invalidation: loss of $608. (22% probability)
PRICE TARGETS
For the 4-day timeframe, the range width should be about 3–6% of price. A range of $596.50 to $629.50 is $33.00 wide, or 5.4% of $614.98, which fits the guidance.
- Target Price: $609.00
- Expected Range: $596.50 to $629.50
- Key Levels: Support at $605.69, Resistance at $619.13
OVERALL BIAS
OVERALL BIAS: BEARISH - Price is below all key moving averages, −DI dominates with ADX at 36, CMF shows persistent distribution, and RSI and MACD remain weak. The mild RSI divergence and the contracted bands argue for a limited downside and some bounce risk, so conviction is modest.
This is educational analysis and not financial advice.