META 34-day bearish forecast — Nov 15, 2026
- Bias: Bearish
- Timeframe: 34 days (made Nov 15, 2026, target date Dec 18, 2026)
- Price at analysis: $641.69
- Price target: $622.00
- Expected range: $566.00 – $668.00
- Result: Pending — graded after the close on Dec 18, 2026
Get a free AI analysis of META today
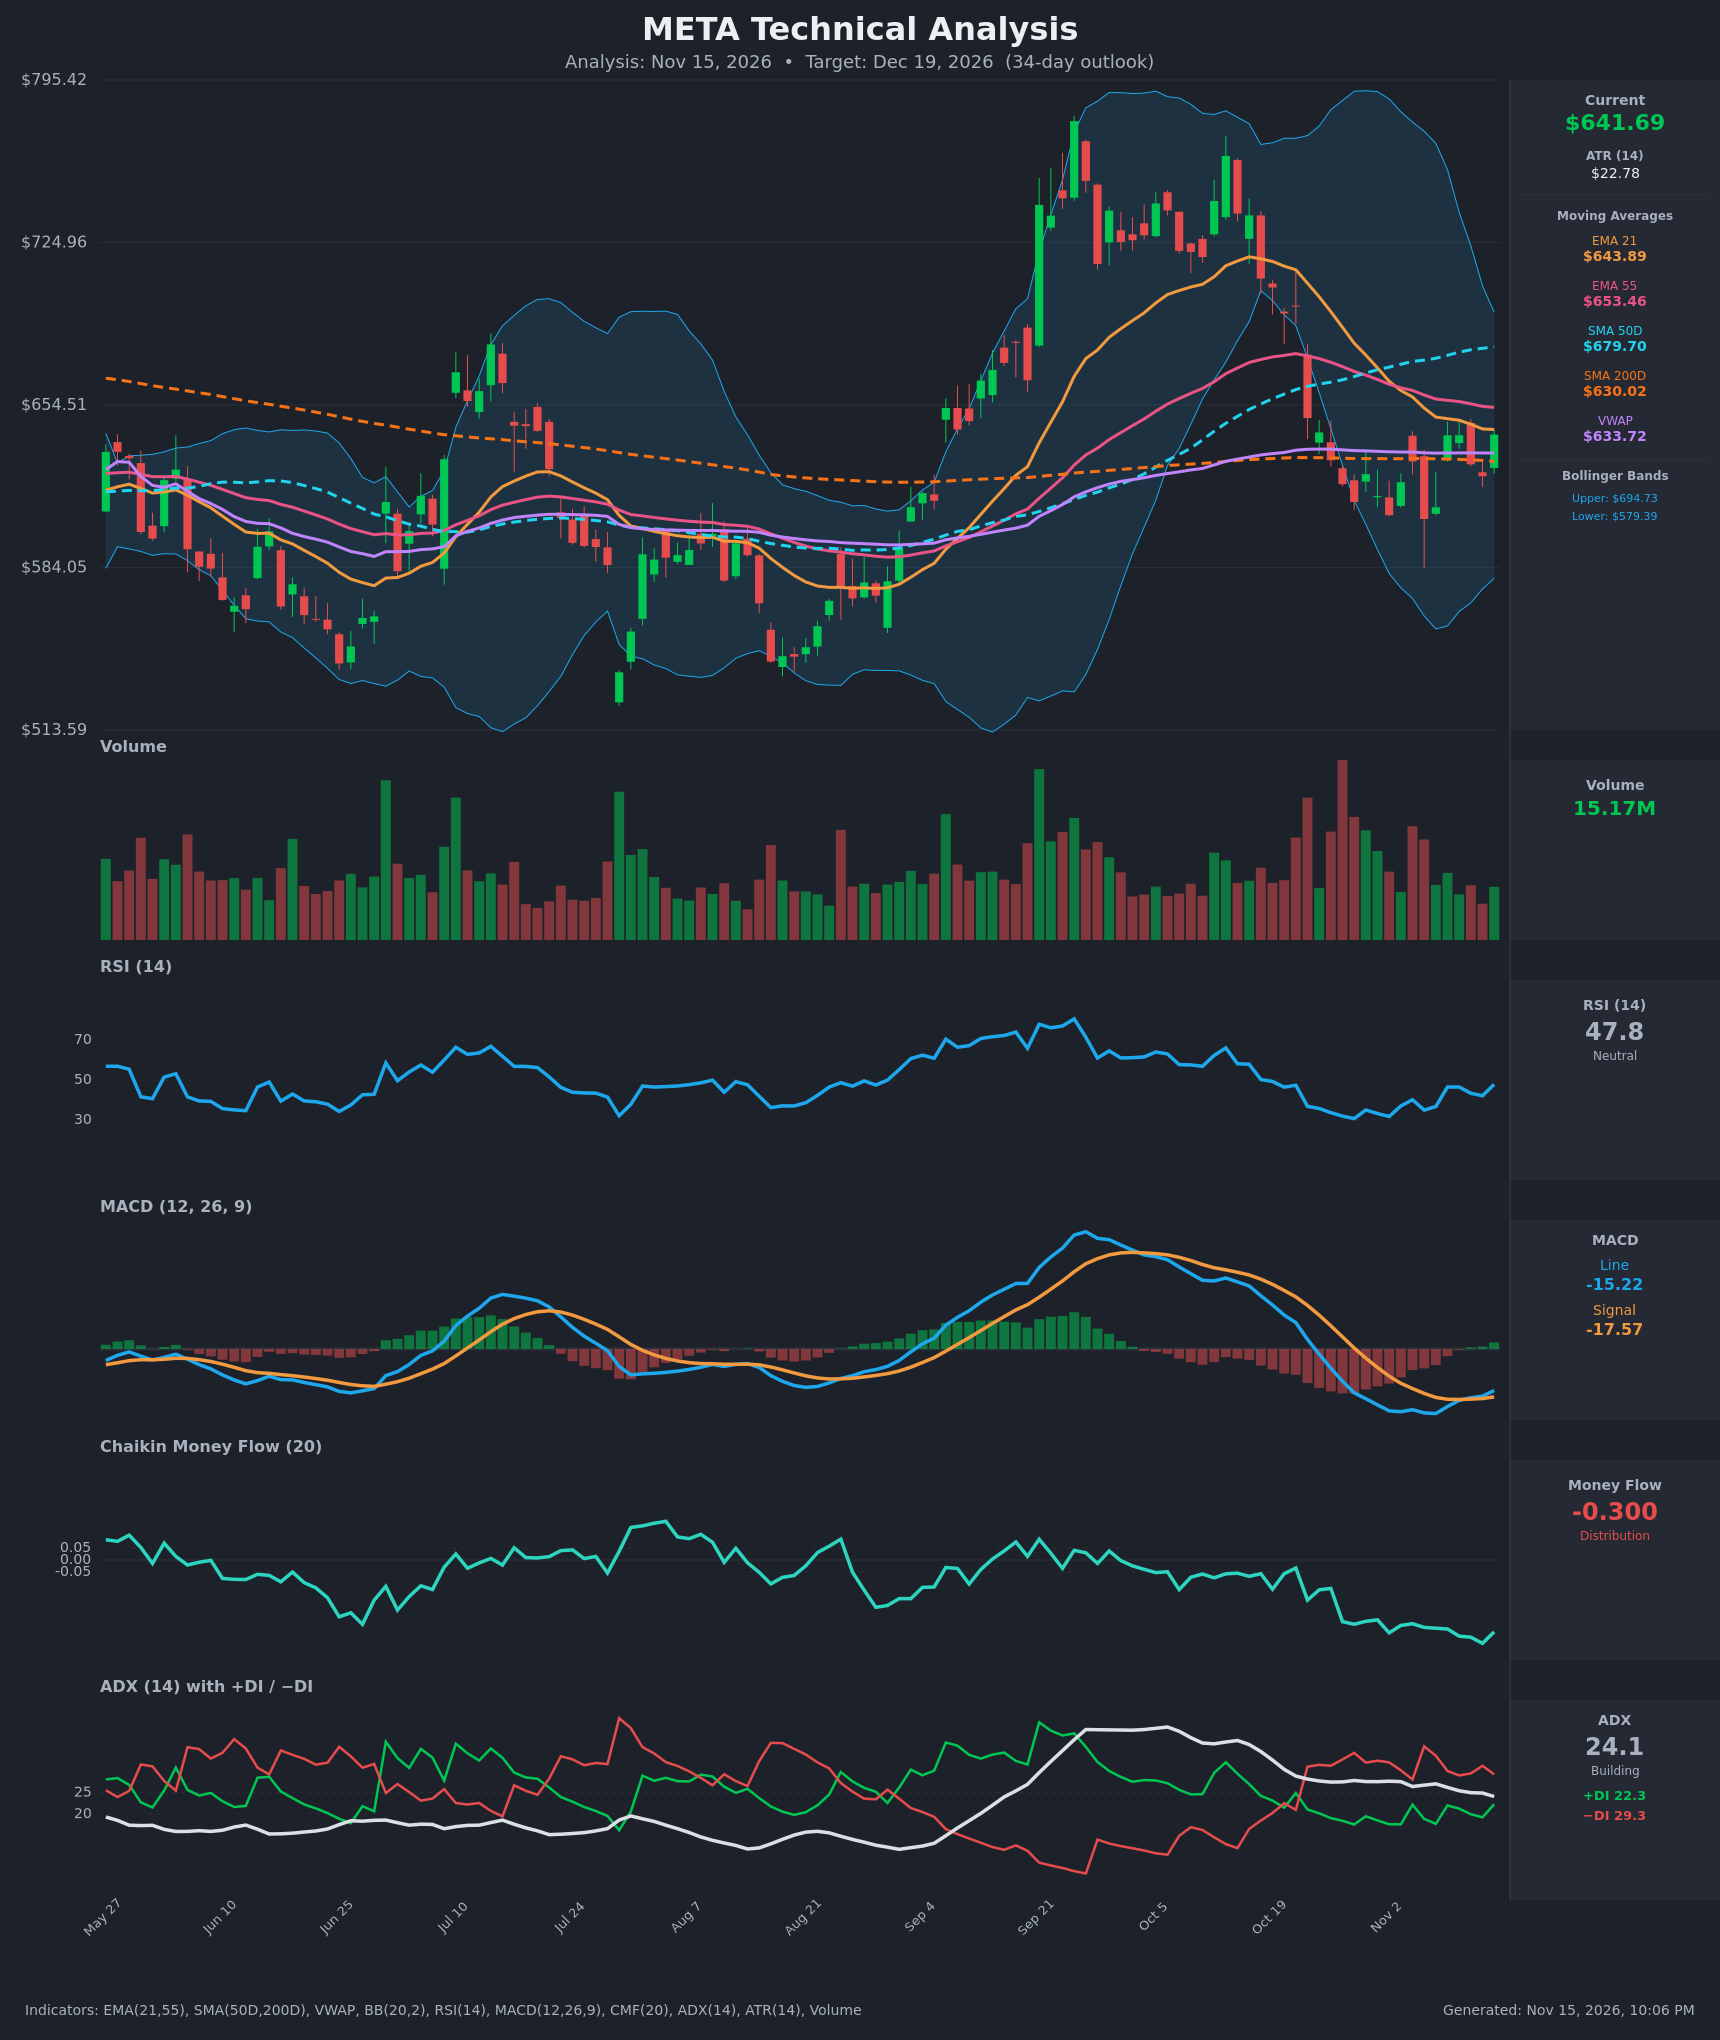
Analysis
TECHNICAL INDICATORS
- RSI (14): 47.8, neutral and recovering from the 30-37 zone in early November. It is still below 50 and has not confirmed a bullish regime. [Neutral]
- 20 EMA: The 21 EMA is $643.89 and price ($641.69) sits just under it, so it acts as immediate resistance. The EMA21 is also below the EMA55 ($653.46), so the short-term bearish crossover is still in force. [Bearish]
- MACD: The line (-15.22) has crossed above the signal (-17.57) and the histogram has turned slightly positive. This is a bullish crossover, but it happened deep below zero and is likely only a relief bounce within a downtrend. [Neutral]
- Bollinger Bands (20): Upper $694.73, lower $579.39, midline about $637. Price is near the middle of the bands. The bands are narrowing after the sharp October-November selloff, which suggests volatility is compressing. [Neutral]
- CMF (20): -0.300, deep in distribution and near its lows for the period, with no improvement during the bounce. Volume flows are not confirming the rebound. [Distribution]
- ADX (14): 24.1 and drifting down from about 27.5, so trend strength is fading but still close to the 25 threshold. −DI (29.3) is above +DI (22.3), so sellers still control direction. [Moderate Trend, Bearish]
- Volume: 15.17M, about average, with no surge on the recent green candles. The bounce lacks conviction, while the heavy-volume bars came on the October selloff. [Neutral to Mildly Bearish]
DIVERGENCES & TRENDS
- MACD has crossed up while CMF kept making new lows. This is a momentum-versus-money-flow divergence that favors the bearish side, because the rebound is not backed by buying.
- Price has lower highs since the September peak near $770. It is below the SMA50 ($679.70, still rising but far above price) and the EMA55.
- The EMA21 crossed below the EMA55 in early November. There is no death cross, since SMA50 ($679.70) is still above SMA200 ($630.02). The gap between them is narrowing.
- Price is above the SMA200 ($630.02) and VWAP ($633.72), which gives it a support cushion in the $630-634 area.
- Price has closed at about $641.4-641.7 on Nov 9, Nov 10 and Nov 13, so $641-645 is a clear resistance shelf, reinforced by the EMA21.
- ADX is declining while −DI stays on top. This points to a decelerating downtrend, which could mean either a base or a consolidation.
CHART PATTERNS
- Possible Bullish Double Bottom: Lows at about $605-607 (Nov 2 and Nov 5) with a neckline near $641-645. Price is testing that neckline now. A confirmed breakout would target roughly $680, which is the neckline plus the pattern height of about $37 and also the SMA50 area. Confirmation requires a close above about $650 on volume, and CMF does not support it yet.
- Rejection at resistance: Repeated stalls at $641 and the EMA21 look like a bearish lower-high structure inside a broader downtrend. A failure here would target a retest of $605 and then the lower band near $579.
- Neither pattern is confirmed yet. The weight of evidence (CMF, DI, MAs) favors the failed-breakout path.
POTENTIAL SCENARIOS
- Scenario 1: Bearish Rejection and Breakdown — Price fails at the $641-654 resistance cluster (EMA21/EMA55), loses the SMA200 and VWAP, and breaks the $605 double-bottom lows as distribution continues. Trigger: daily close below $630. Target: $605, then $580 (lower Bollinger Band). Invalidation: daily close above $655 with rising volume. (45% probability)
- Scenario 2: Bullish Double Bottom Breakout — Price clears the $645-655 resistance, the MACD bounce extends, and buyers push toward the falling-then-flat SMA50. Trigger: close above $655 on above-average volume. Target: $680-695 (SMA50 and upper Bollinger Band). Invalidation: close back below $630. (35% probability)
- Scenario 3: Neutral Range Chop — Price oscillates between the $605 lows and the $655 resistance as ADX fades and the bands compress. Trigger: failure to close outside $605-655. Target: $625-645. Invalidation: a decisive close outside the range. (20% probability)
PRICE TARGETS
- Target Price: $622.00 (34-day, Dec 19, 2026)
- Expected Range: $566.00 to $668.00 (width $102, about 15.9% of the current price, consistent with the 30-60 day guidance of 12-18%)
- Key Levels: Support at $630.02 (SMA200), Resistance at $653.46 (EMA55)
OVERALL BIAS
OVERALL BIAS: BEARISH - CMF at -0.300 shows heavy distribution, −DI is above +DI, and price is capped under the EMA21, EMA55 and SMA50 while repeatedly failing near $641. The MACD crossover and the SMA200 support keep conviction modest, so a decisive close above $655 would invalidate this view.
This is educational analysis and not financial advice.