META 20-day bearish forecast — Nov 15, 2026
- Bias: Bearish
- Timeframe: 20 days (made Nov 15, 2026, target date Dec 4, 2026)
- Price at analysis: $641.69
- Price target: $622.00
- Expected range: $590.00 – $655.00
- Result: Pending — graded after the close on Dec 4, 2026
Get a free AI analysis of META today
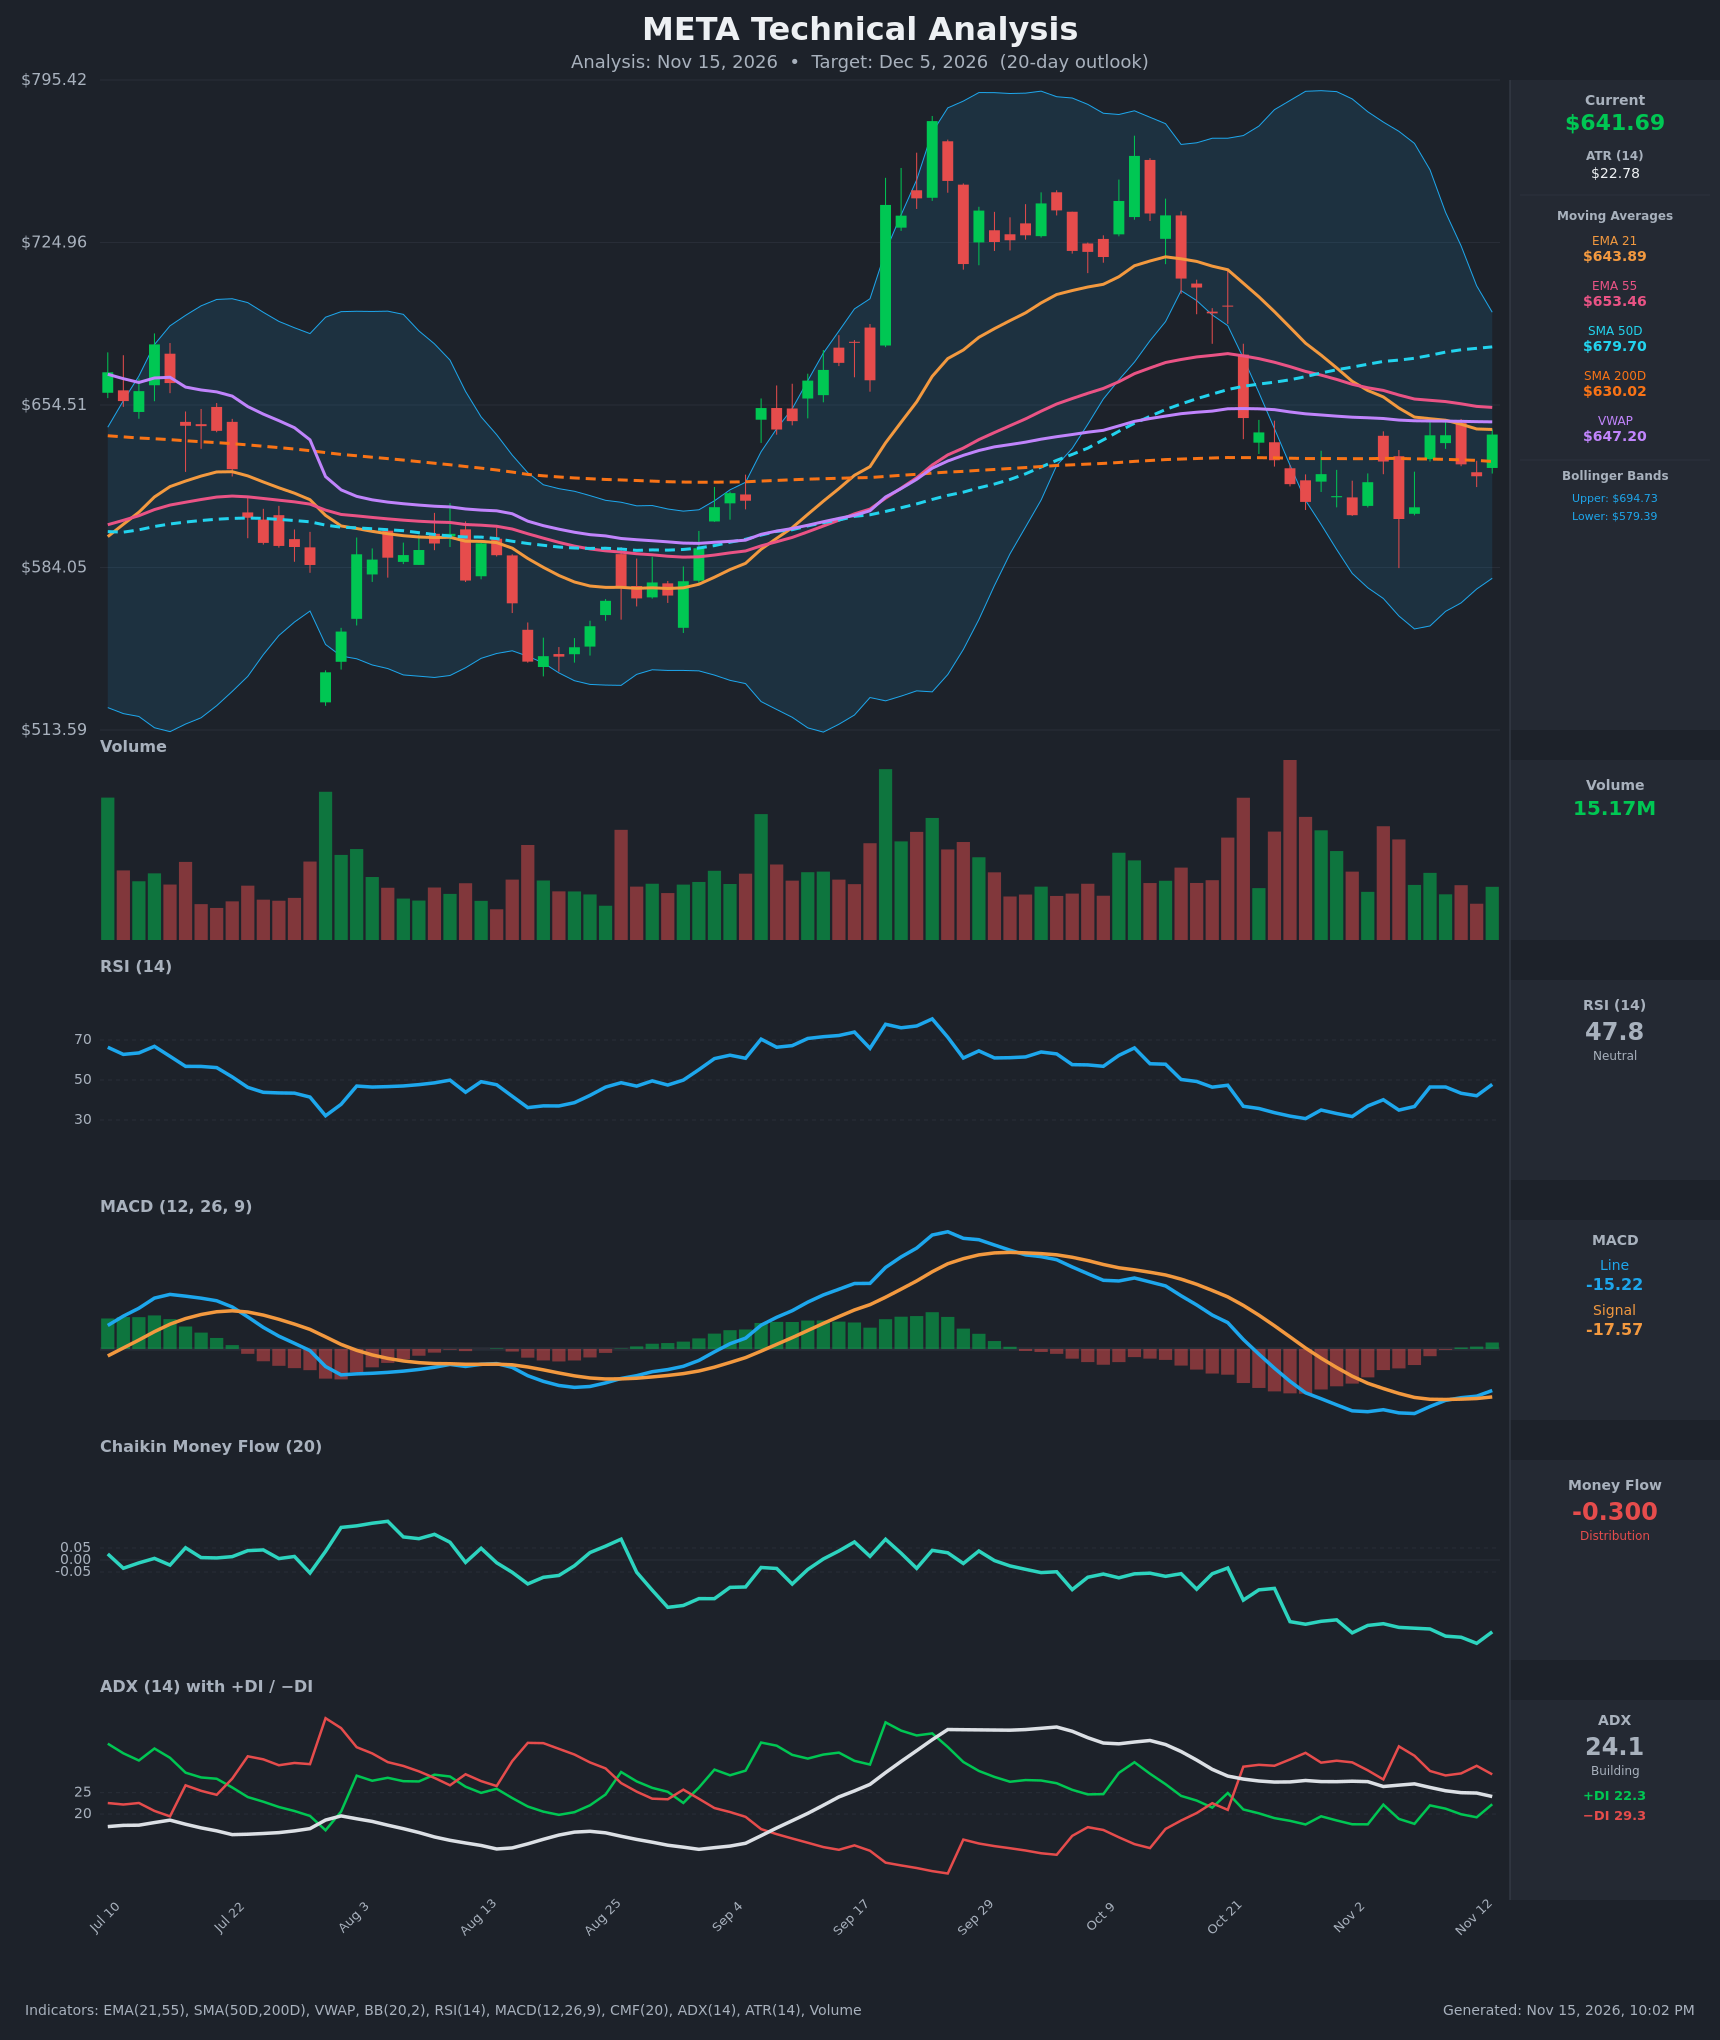
Analysis
TECHNICAL INDICATORS
- RSI (14): 47.8, recovering from oversold (~31 on Oct 28 and Nov 2) but still below the 50 midline. Momentum is improving, though it has not confirmed a bullish regime. [Neutral]
- 20 EMA (EMA 21: $643.89): Price at $641.69 sits just under the EMA 21. The EMA is falling steeply, from $695 on Oct 26 to $644 now, and acts as overhead resistance. EMA 21 is also below EMA 55 ($653.46) after a bearish cross in early November. [Bearish]
- MACD: Line -15.22 vs signal -17.57, so the line crossed above the signal around Nov 11. The histogram has just turned slightly positive. Both lines are deeply negative, so this is only a tentative momentum bounce inside a downtrend. [Neutral]
- Bollinger Bands (20): Upper $694.73, lower $579.39, midline about $637. Price is mid-band, right at the basis, after bouncing from the lower-band area near $605. The bands are narrowing from their prior expansion, which points to consolidation. [Neutral]
- CMF (20): -0.300, well below -0.05 and near the lowest level on the chart. Distribution has persisted for weeks, and the Nov 13 bounce has not been accompanied by buying pressure. [Distribution]
- ADX (14): 24.1 and drifting lower from about 27.5, near the 25 threshold. −DI (29.3) is above +DI (22.3), so sellers still lead, but the gap has narrowed from 15 points to 7. [Moderate Trend, Bearish Direction]
- Volume: 15.17M on the latest green candle, roughly average. The bounce from $605 has not come with notable volume expansion. The heaviest recent volume was on red candles in late October to early November. [Neutral to slightly Bearish]
Other levels:
- SMA 200: $630.02, just below price, so META holds above its long-term trend line.
- SMA 50: $679.70, above price and rising, so there is no death cross.
- VWAP: $647.20, above price and acting as resistance.
DIVERGENCES & TRENDS
- RSI: It made a higher low (~31 on Nov 2 vs ~30 on Oct 28) while price made a lower low ($606.73 vs $612.49). This is a mild bullish divergence and explains the bounce.
- CMF vs price: CMF is making new lows while price bounces. That is a bearish divergence, meaning the rally lacks accumulation.
- MACD: A bullish line/signal crossover occurred on Nov 11, but it is below zero, so it is a weak signal.
- Moving averages: EMA 21 crossed below EMA 55 in early November. Price has been rejected near the EMA cluster ($644–$653) and VWAP ($647).
- DI and ADX: The −DI lead is shrinking and ADX is fading, so selling pressure is easing. The trend is not yet reversed.
- Price structure: Lower highs since the ~$760 peak in early October. Price has failed three times near $641 (Nov 9, 10, 13).
CHART PATTERNS
- Bullish Double Bottom (reference diagram): Lows near $605–$607 (Nov 2 and Nov 5) with a neckline near $641–$642. A confirmed close above the neckline implies a measured move of about $36 to roughly $677. Price is sitting exactly at the neckline and has not yet broken it.
- Competing structure: Lower highs from October and a declining EMA stack (EMA 21 < EMA 55 < SMA 50) resemble a bearish continuation or range. Failure at $641 with CMF at -0.30 would turn the double bottom into a failed pattern, with a retest of $605 and then the $580 lower Bollinger Band.
- The $630 SMA 200 is the key pivot beneath price.
POTENTIAL SCENARIOS
- Scenario 1: Bearish Rejection at Neckline/EMA Cluster — Price fails at $641–$653 resistance, where EMA 21, VWAP and EMA 55 converge. Distribution (CMF -0.30) and −DI dominance pull it back through the SMA 200 toward the prior lows. Trigger: daily close below $630. Target: $606 retest, with an extension toward $590 if broken. Invalidation: daily close above $654. (47% probability)
- Scenario 2: Bullish Double Bottom Breakout — A close above the $642 neckline on rising volume, with RSI crossing 50 and MACD building a positive histogram, confirms the pattern and squeezes price through the EMA cluster. Trigger: daily close above $654 on higher volume. Target: $677–$680 (measured move and SMA 50). Invalidation: close below $630. (35% probability)
- Scenario 3: Neutral Range Chop — Price oscillates between $606 and $654 as ADX fades and the Bollinger Bands narrow. Trigger: failure to close beyond either $630 or $654. Target: $625–$645. Invalidation: a decisive close outside $606–$654. (18% probability)
PRICE TARGETS
For the 20-day timeframe, the range width is about 10%, scaled for 14–21 days.
- Target Price: $622.00
- Expected Range: $590.00 to $655.00 (width $65 ≈ 10.1% of current price)
- Key Levels: Support at $630.02 (SMA 200; below that $606), Resistance at $653.46 (EMA 55; the $644–$647 EMA 21/VWAP cluster comes first)
OVERALL BIAS
OVERALL BIAS: BEARISH - The weight of evidence leans lower: CMF at -0.30 shows heavy distribution, −DI leads +DI, and price is capped by the falling EMA 21, VWAP, EMA 55 and SMA 50 after a third rejection at $641. The RSI divergence and MACD crossover keep the double-bottom breakout a real risk, so conviction is modest. A close above $654 would invalidate this view.
This is educational analysis and not financial advice.