META 62-day bearish forecast — Nov 15, 2026
- Bias: Bearish
- Timeframe: 62 days (made Nov 15, 2026, target date Jan 15, 2027)
- Price at analysis: $641.69
- Price target: $622.00
- Expected range: $558.00 – $683.00
- Result: Pending — graded after the close on Jan 15, 2027
Get a free AI analysis of META today
Analysis
TECHNICAL INDICATORS
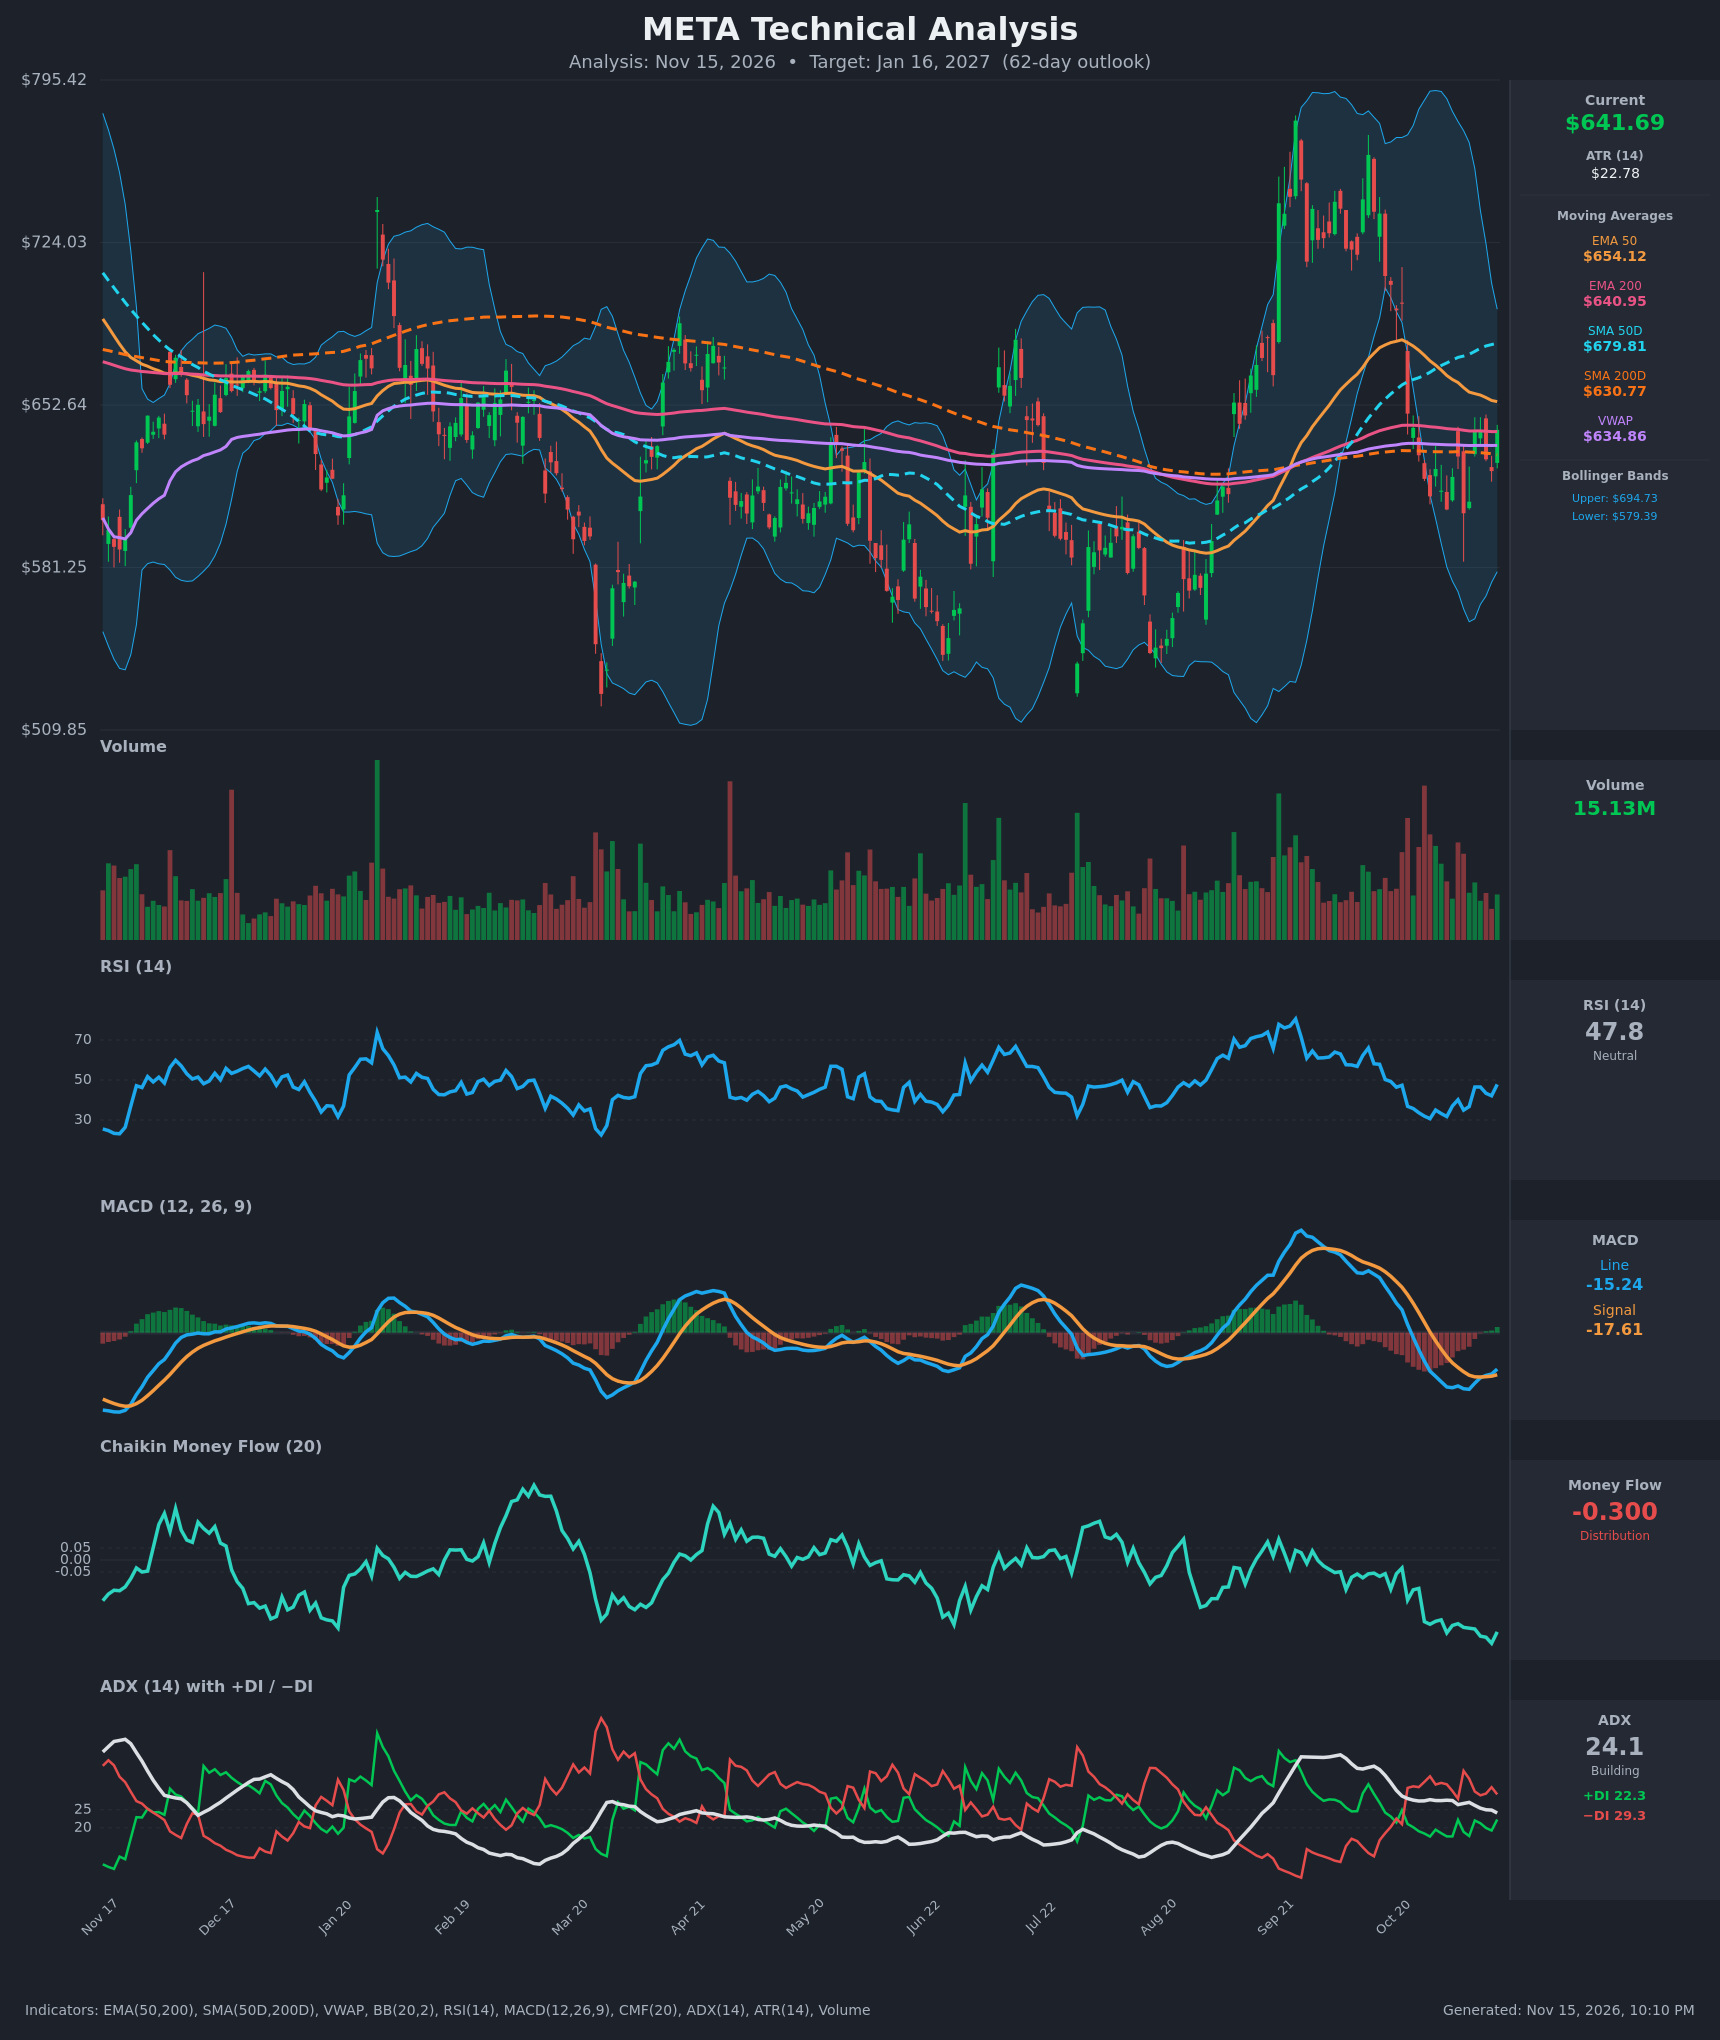
- RSI (14): 47.79, neutral and bouncing from the 31-33 oversold zone in early November. Momentum is recovering but has not crossed above 50. [Neutral]
- 20 EMA: No 20 EMA is supplied. The EMA 50 ($654.12) is falling and sits above price, acting as resistance. EMA 200 ($640.95) is almost exactly at price, so price is chopping around it. [Bearish]
- MACD: Line -15.24 is above signal -17.61 after a bullish cross around Nov 10-11, and the histogram is slightly positive. Both lines are still well below zero, so this is a weak relief signal inside a negative-momentum regime. [Neutral]
- Bollinger Bands (20): Upper $694.73, lower $579.39, midline about $637. Price is just above the midline after bouncing off the lower half. The bands have narrowed from the September expansion, so volatility is compressing. [Neutral]
- CMF (20): -0.300, which is heavy distribution. It has fallen steadily from -0.12 to a new low even as price bounced, so the rally lacks buying support. [Distribution]
- ADX (14): 24.1, just under the 25 trend threshold and drifting down from 27+. −DI (29.3) is above +DI (22.3), so sellers are in control of a moderately strong trend. [Moderate Trend - Bearish]
- Volume: 15.13M, around average with no clear surge on the bounce. Heavy red-volume days in late October and early November marked the selling. Up-moves lack volume confirmation. [Neutral to Mildly Bearish]
DIVERGENCES & TRENDS
- CMF divergence: Price bounced from about $606 to $641, but CMF made new lows (-0.30 to -0.35). This is a bearish volume divergence, and the rebound looks like low-conviction short covering.
- MACD vs RSI: MACD crossed up and RSI rose from 31 to 48, which is a bullish momentum divergence from the Nov 5-6 lows. It is the main counterpoint to the CMF reading.
- Moving averages: Price is below EMA50 and SMA50D, which is bearish. It is above EMA200, SMA200D and VWAP, which is a long-term support cluster at $631-$641. The SMA50D ($679.81) is still above the SMA200D ($630.77), so there is no death cross yet. The gap is likely to narrow because price is well below the SMA50D.
- Structure: Lower highs since the September peak near $790. Closes at $641.37, $641.39 and $641.69 show repeated stalling at the same level.
CHART PATTERNS
- Bearish Triple Top / Double Top (minor): Three failed pushes at about $641 over the last few sessions. A close below the $605-$610 swing lows would confirm the break, with a measured move toward about $575-$580. That is the lower Bollinger Band and the area of earlier-year lows.
- Bullish Triple Bottom / Double Bottom (competing): Lows at $606.73 and $605.08 form a base. The neckline is the $641 area, with a break targeting about $680, which is the SMA50D.
- Broader context: Price is in a roughly year-long $580-$700 range, with the post-September decline from the highs acting as a bear flag or lower-high structure. The distribution reading tilts the odds toward the bearish resolution.
POTENTIAL SCENARIOS
- Scenario 1: Bearish Rejection and Breakdown — Price fails again at $641-$654 (EMA50), distribution continues, and sellers retest and break the $605 lows. Trigger: daily close below $605 on rising volume. Target: $580 (lower Bollinger Band), with possible overshoot to $560. Invalidation: daily close above $680 (SMA50D). (45% probability)
- Scenario 2: Bullish Base Breakout — The MACD cross and RSI recovery hold, and price clears the $641-$654 resistance cluster and squeezes toward the SMA50D. Trigger: close above $655 with a CMF turn upward. Target: $680-$695. Invalidation: close below $605. (35% probability)
- Scenario 3: Neutral Range Chop — Price oscillates between $605 and $655 around the 200-day averages as volatility compresses. Trigger: ADX falling below 20 with CMF flattening. Target: $625-$650. Invalidation: close outside $600-$680. (20% probability)
PRICE TARGETS
- Target Price: $622.00 (62-day outlook, about -3.1% from current)
- Expected Range: $558.00 to $683.00 (width $125, about 19.5% of current price, consistent with the 61-180 day guidance)
- Key Levels: Support at $606.00, Resistance at $654.12
OVERALL BIAS
OVERALL BIAS: BEARISH - Deeply negative CMF (-0.30) with a bearish divergence against the bounce, −DI above +DI, repeated rejections at $641, and price below the falling EMA50 and SMA50D outweigh the weak MACD cross and the support from the 200-day averages. Conviction is modest because the $605-$631 support cluster is still intact.
This is educational analysis and not financial advice.