META 6-day bearish forecast — Nov 1, 2026
- Bias: Bearish
- Timeframe: 6 days (made Nov 1, 2026, target date Nov 6, 2026)
- Price at analysis: $614.98
- Price target: $609.00
- Expected range: $594.00 – $630.00
- Result: Correct (-0.8%) — closed at $610.15 on Nov 6, 2026; quality score 100/100
Get a free AI analysis of META today
Analysis
TECHNICAL INDICATORS
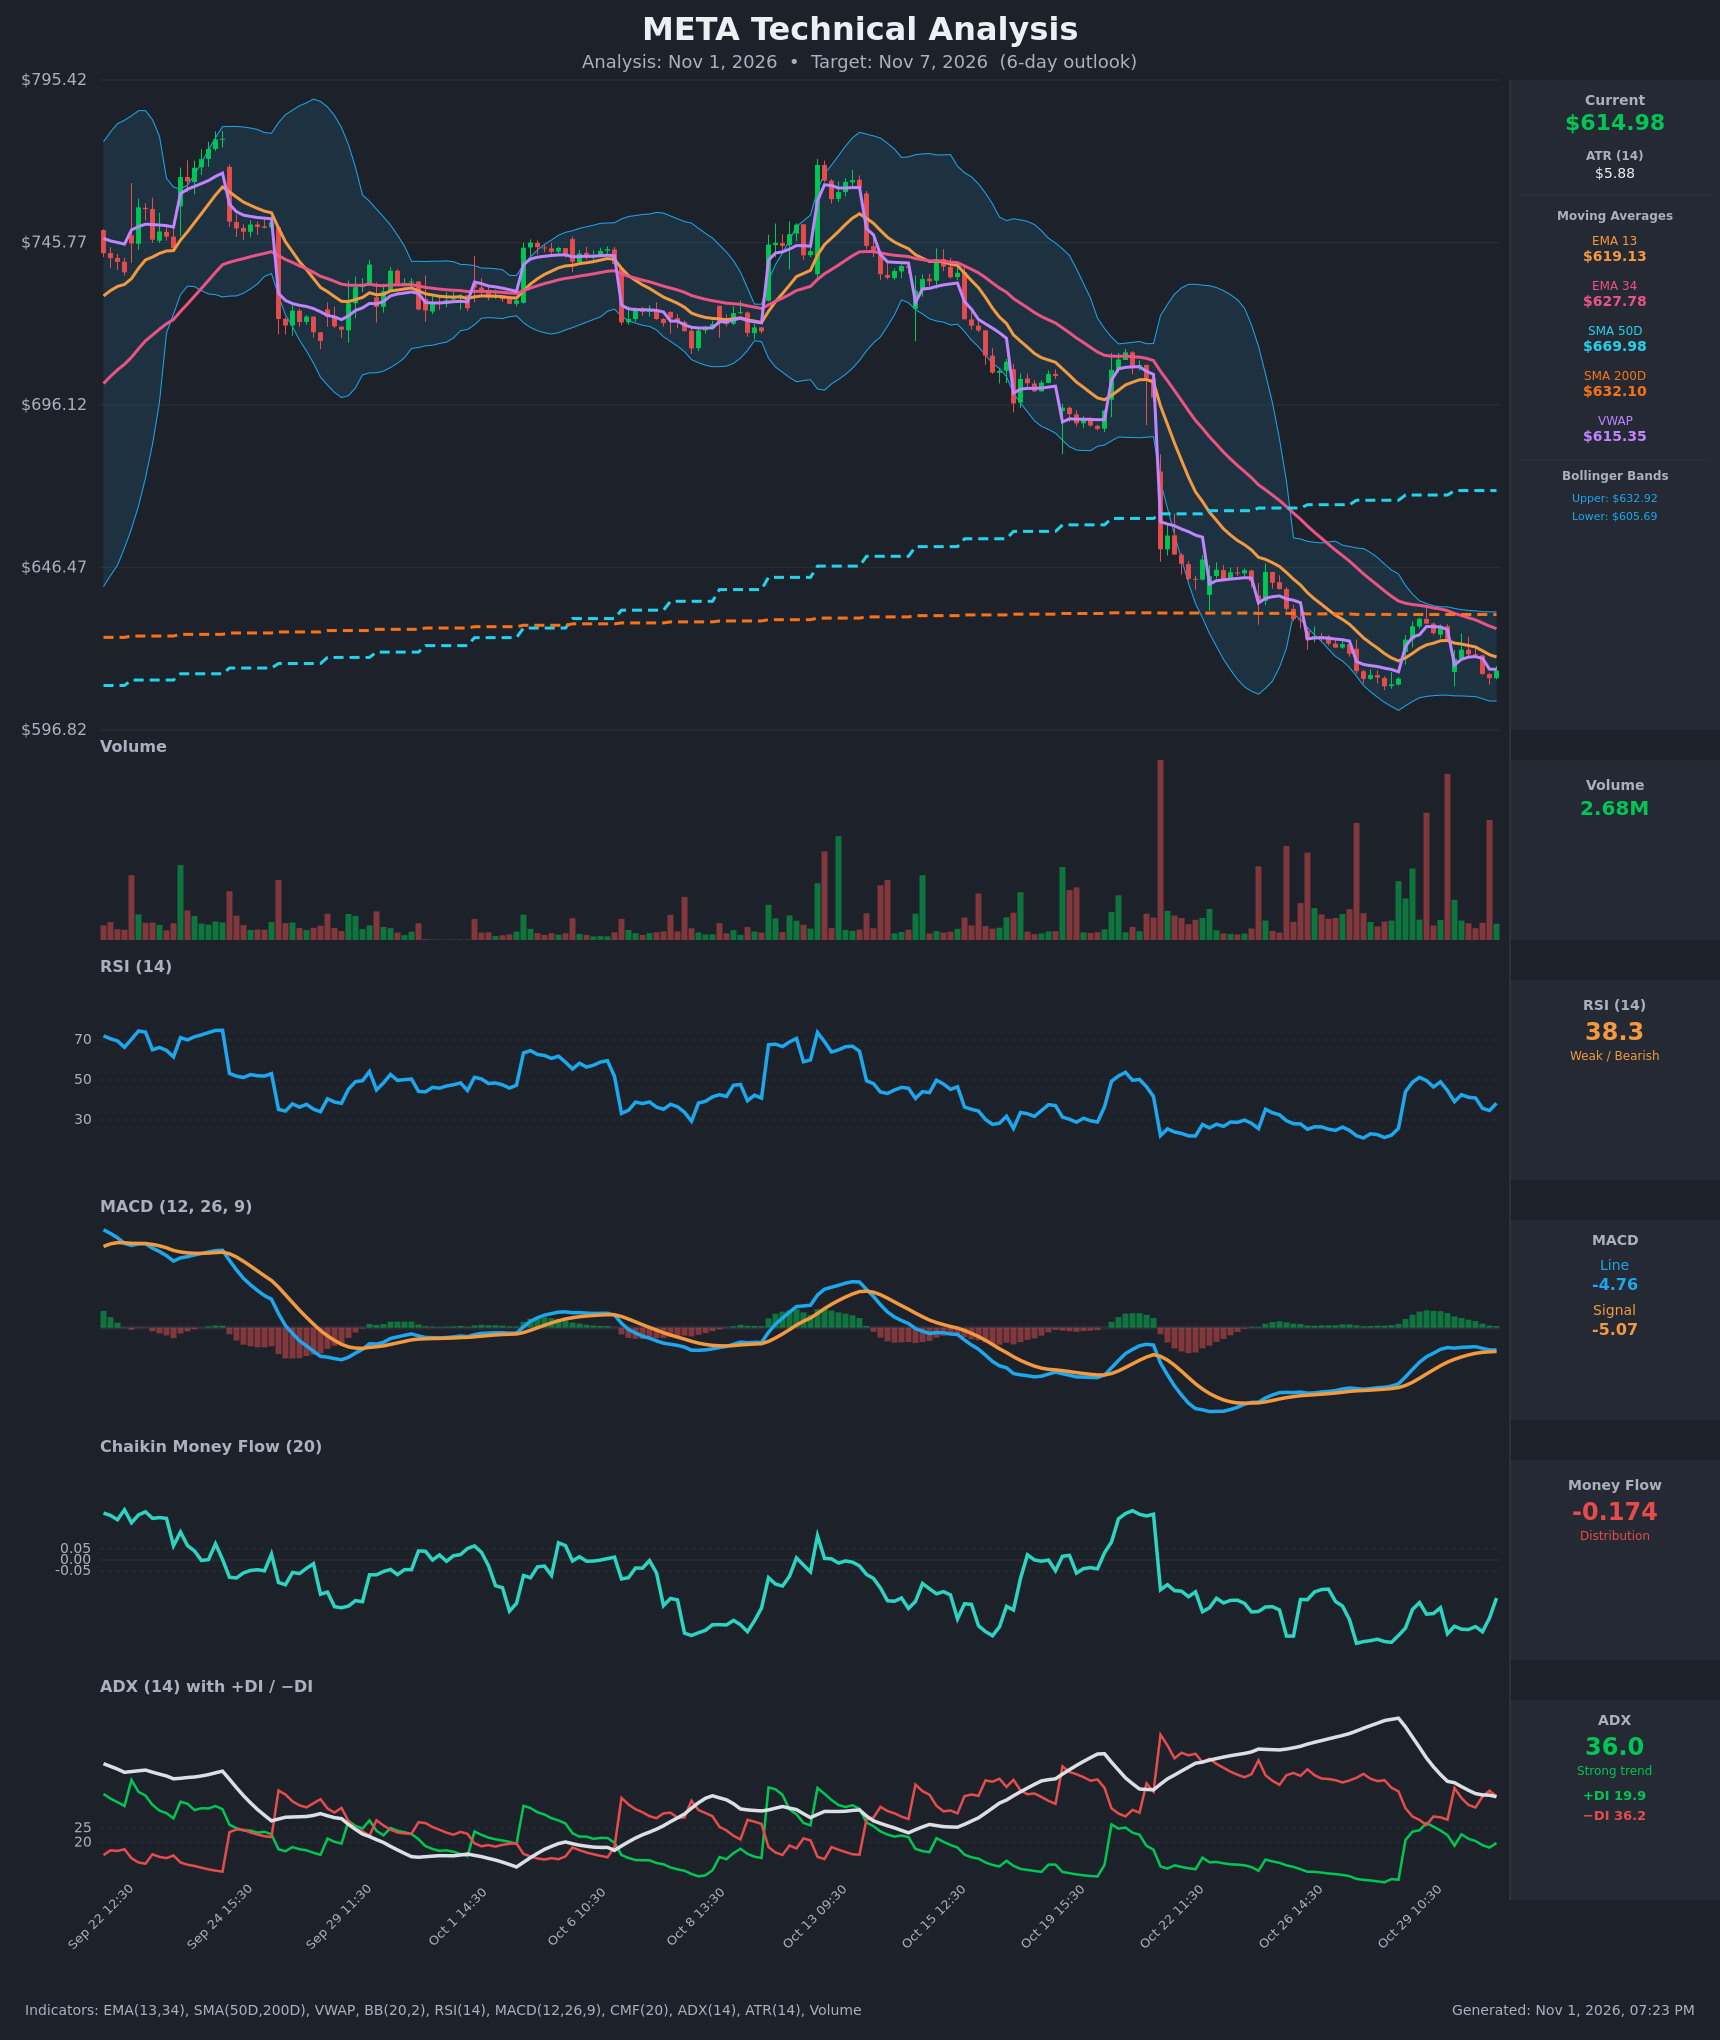
- RSI (14): 38.34, below the 50 midline and above oversold (30). It bounced from 25.8 on Oct 28 to about 51, then rolled over again. It is making lower highs, so momentum is weak but not extreme. [Bearish]
- 20 EMA: The chart shows EMA 13 at $619.13 and EMA 34 at $627.78 (no 20 EMA value was supplied). Price at $614.98 is below both, and EMA13 sits below EMA34, so both act as overhead resistance. [Bearish]
- MACD: Line -4.756 is just above signal -5.071, a marginal bullish crossover from the Oct 29 pullback. The line has been flat to slightly falling for 8 bars (-4.2 to -4.76) and the signal is converging down toward it. The histogram is barely positive (+0.31) and fading. Momentum is bottoming at best, with no real buy signal. [Neutral]
- Bollinger Bands (20): Upper $632.92, lower $605.69, so price sits in the lower half, about 34% of the band width. The bands have contracted sharply after the October 21 gap drop. The lower band was tested on Oct 28 and the bounce failed at the mid-band area. A walk along the lower band is possible. [Bearish]
- CMF (20): -0.174, well below -0.05 and in sustained distribution all month. It ticked up from -0.327 to -0.174 on the last bar, a minor improvement that still shows selling pressure. [Distribution]
- ADX (14): 36.0 with −DI 36.2 on top of +DI 19.9. The trend is strong and bearish. ADX has eased from 63 as the trend matures, but it is still well above 25. [Strong Trend - Bearish]
- Volume: 2.68M on the latest bar. The heaviest bars recently were on red candles (the Oct 21 gap, Oct 28-30 selloffs), and bounces came on lighter volume. [Bearish interpretation - selling volume dominates]
DIVERGENCES & TRENDS
- Price vs. RSI: Price made a lower low on Oct 28 and again on Oct 30 ($612.66), but the RSI low (34.8) was well above the earlier 25.8. This is a mild bullish divergence, and it is not confirmed.
- MACD: The MACD line is well off its lows (-11.9 to -4.8) while price has stayed pinned near its lows, so downside momentum is fading. A compressed MACD is typical of consolidation within a downtrend.
- MA structure: Price is below EMA13, EMA34, SMA200D ($632.10, a long-term support turned resistance) and SMA50D ($669.98). EMA13 is below EMA34. SMA50D is well above SMA200D, so there is no death cross yet, though the 50D is flattening and the gap is likely to narrow.
- VWAP: $615.35, with price only $0.37 below, so it is neutral-to-slightly-bearish.
- DI: −DI has stayed above +DI since the Oct 21 gap. The Oct 29 near-crossover (+DI 26.8 vs −DI 26.1) failed.
CHART PATTERNS
- Bearish continuation / consolidation: Price formed a lower-high series after the Oct 21 gap down. The Oct 29 bounce to about $631 was rejected at the SMA200D/EMA34 zone, and it resembles a Bearish Flag/Pennant at the base of the sharp drop. A break below $605-$606 (the lower Bollinger Band and the Oct 28 low area) would give a measured target toward the $590s.
- Possible Bullish Falling Wedge / Double Bottom: Lows near $612 (Oct 28 and Oct 30) with RSI divergence hint at a double bottom, but price has not broken above the $631 neckline. It is unconfirmed, and it would need a close above about $632, where the upper Bollinger Band, SMA200D and EMA34 cluster.
- ATR of $5.88 implies a typical 6-day move of about $14 (roughly 2.4 ATR, or 1 ATR × √6).
POTENTIAL SCENARIOS
- Scenario 1: Bearish Downtrend Continuation — Price remains below the falling EMAs and the SMA200D. Strong ADX with −DI dominance and persistent CMF distribution point to a retest of the lower band and a push into the low-$600s. Trigger: break and close below $605.70, or a rejection at EMA13 around $619-$620. Target: $598-$603. Invalidation: close above $632 (SMA200D and upper band). (50% probability)
- Scenario 2: Neutral Range Chop — Volatility is compressed and RSI divergence supports a base. Price oscillates between $605 and $626 around VWAP. Trigger: failure of both the $605 breakdown and the $632 breakout. Target: $610-$622. Invalidation: close outside the $605-$632 range. (28% probability)
- Scenario 3: Bullish Relief Bounce — The RSI divergence and the MACD bullish cross spark a mean-reversion rally into the overhead resistance cluster. Trigger: close above EMA13/EMA34 ($619-$628) on rising volume. Target: $630-$635. Invalidation: close back below $609. (22% probability)
PRICE TARGETS
- Target Price: $609.00 (6-day, modest downside; roughly $6 below the current price, about 1 ATR)
- Expected Range: $594.00 to $630.00 (width $36, about 5.9% of the current price, consistent with the 4-8% guidance for a 7-10 day window, appropriately scaled down to 6 days; about 2x the ATR-implied move on either side)
- Key Levels: Support at $605.69 (lower Bollinger Band; next at $598), Resistance at $619.13 (EMA13; then $627.78 EMA34 and $632.10 SMA200D)
OVERALL BIAS
OVERALL BIAS: BEARISH - Price is below every moving average with −DI dominant, ADX at 36, CMF at -0.17 and heavier volume on down days, while the bounce failed at the SMA200D/EMA34 zone. The mild RSI divergence and MACD flattening limit the downside conviction.
This is educational analysis and not financial advice.