MU 6-day bearish forecast — Nov 1, 2026
- Bias: Bearish
- Timeframe: 6 days (made Nov 1, 2026, target date Nov 6, 2026)
- Price at analysis: $884.89
- Price target: $872.00
- Expected range: $846.00 – $900.00
- Result: Correct (-21.7%) — closed at $693.23 on Nov 6, 2026; quality score 50/100
Get a free AI analysis of MU today
Analysis
TECHNICAL INDICATORS
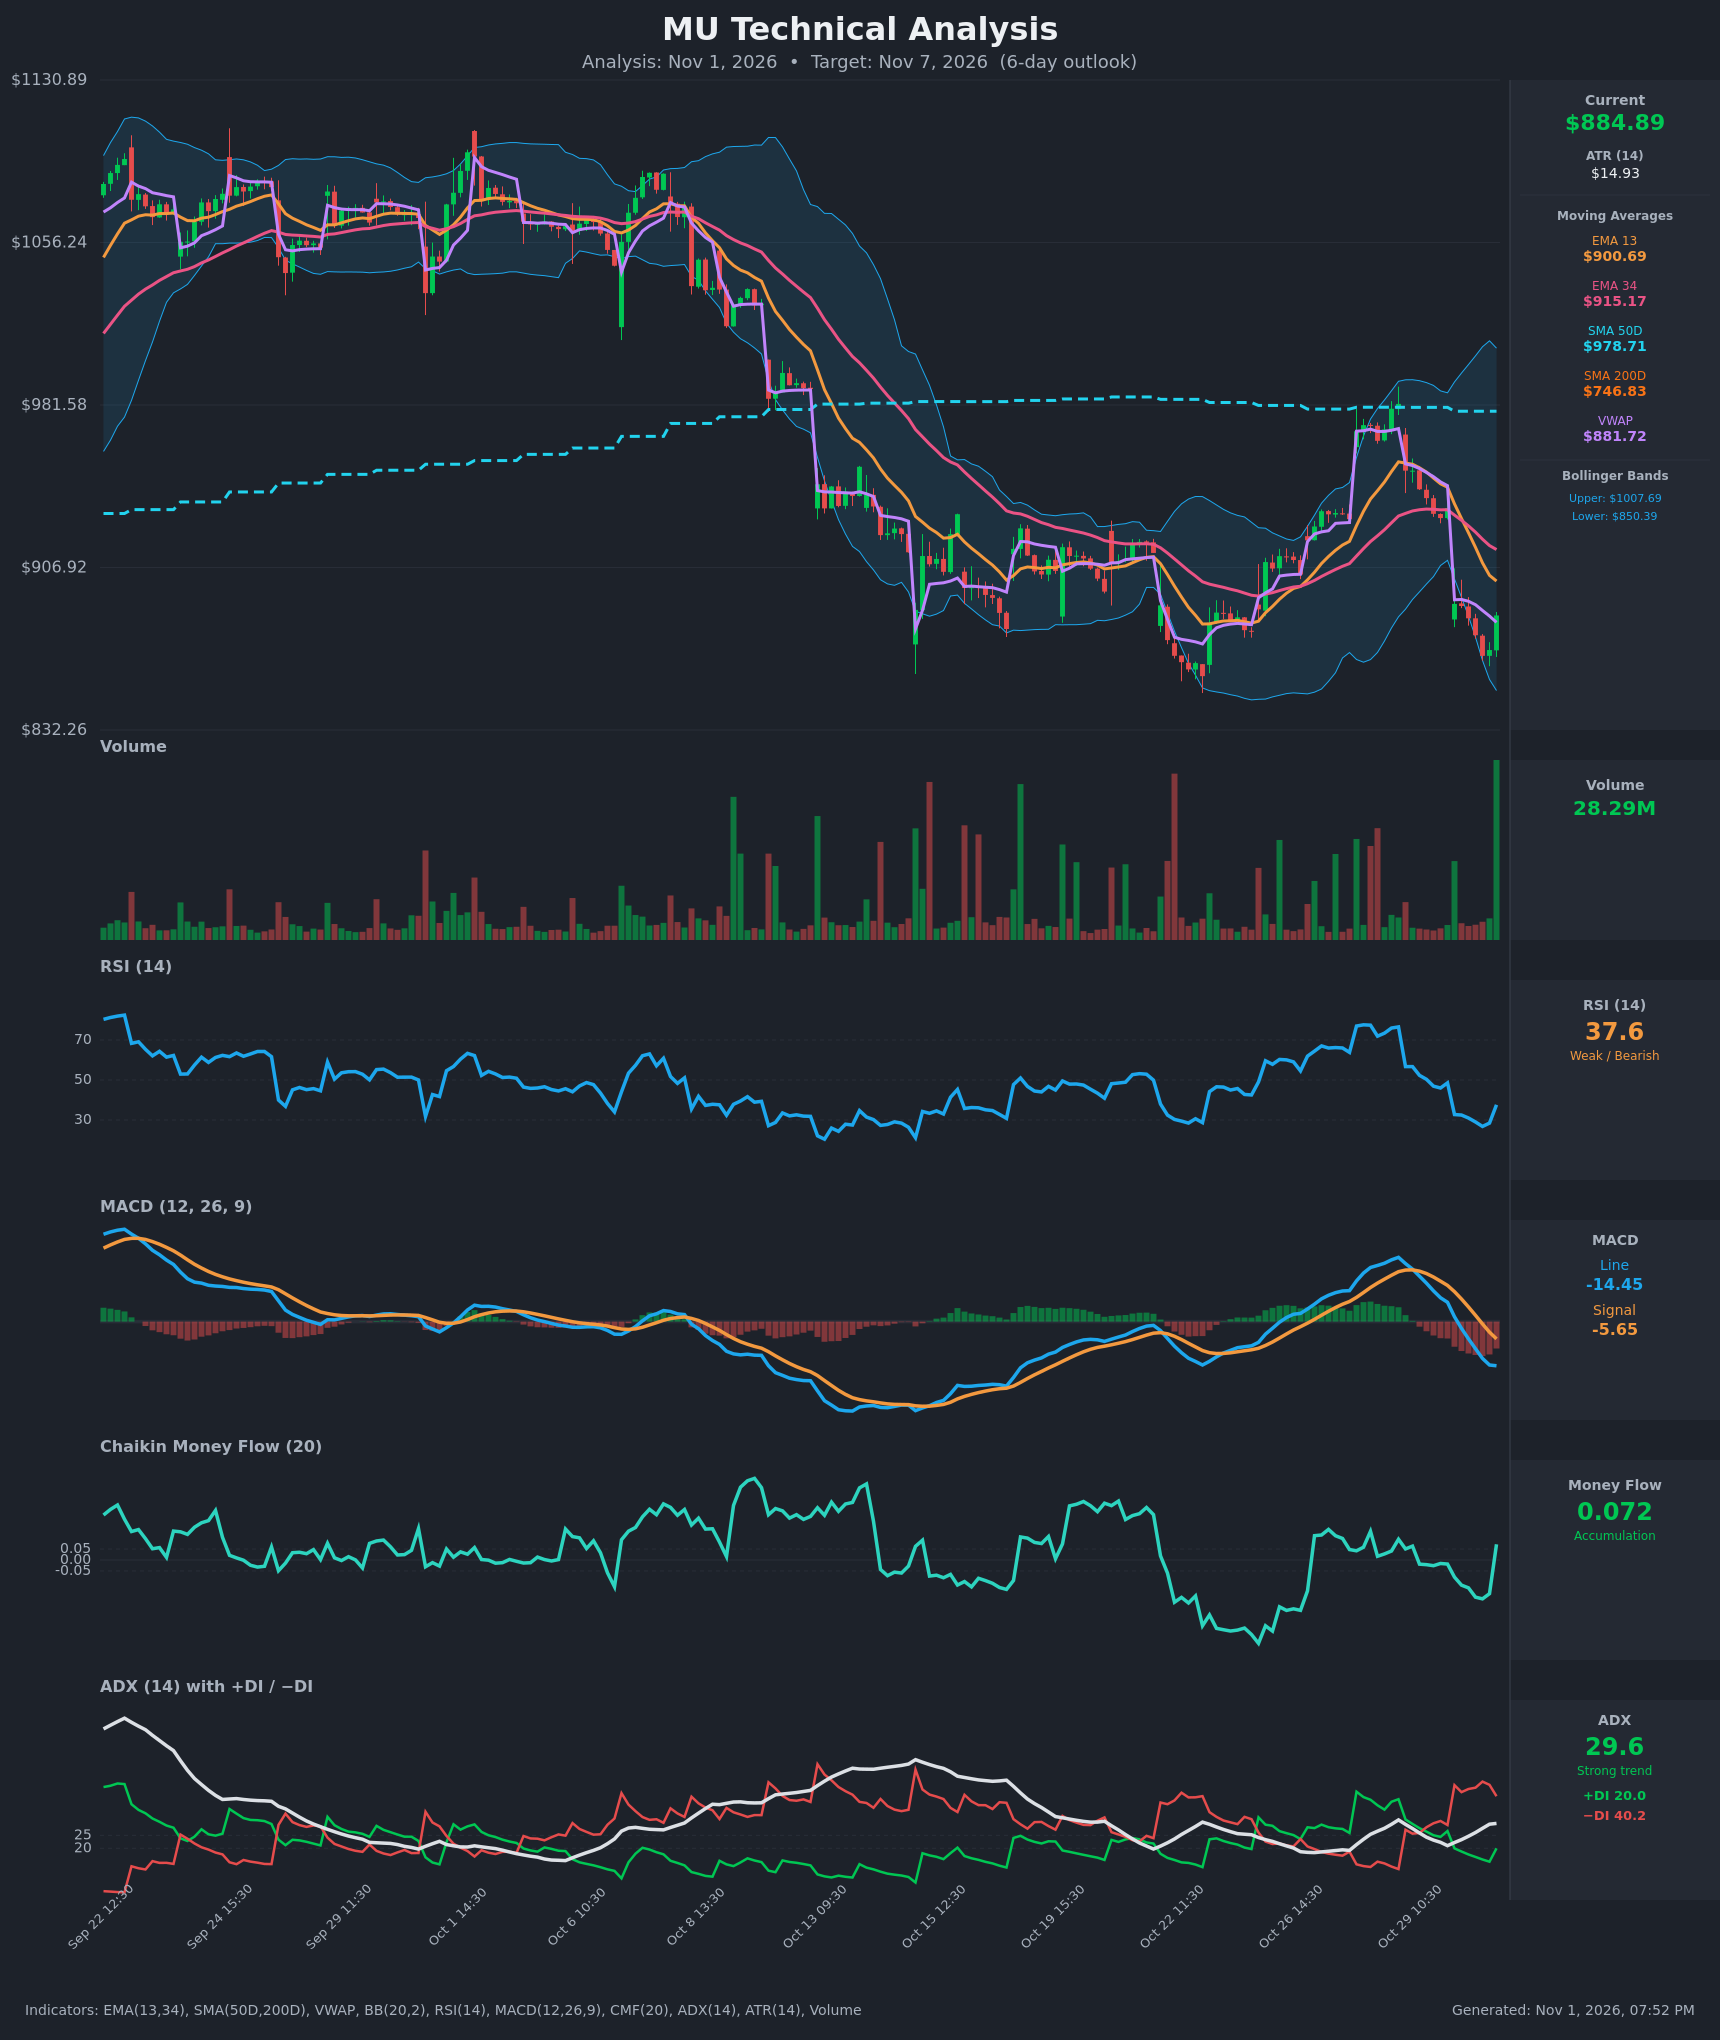
- RSI (14): 37.59, bouncing from a recent low of about 26.8 (oversold) but still well below 50. The bounce is a relief move inside a weak momentum regime. [Bearish]
- EMA 13 / EMA 34 (20 EMA equivalent): EMA13 is $900.69 and EMA34 is $915.17. Price at $884.89 is below both, and EMA13 has crossed below EMA34 (mid-Oct 30). Both slope down and act as overhead resistance. [Bearish]
- MACD: Line -14.45 is below signal -5.65, and the crossover happened on Oct 30. The histogram is deeply negative and still expanding (about -8.8). Momentum is still pointing down, though the line's decline is slowing (-14.20 to -14.45). [Bearish]
- Bollinger Bands (20): Upper $1007.69, lower $850.39, midline about $929. Price sits in the lower quarter of the band, about 4% above the lower band, after a very wide expansion. The bands are still wide, so a walk toward the lower band is possible, but a bounce toward the midline is also normal. [Bearish]
- CMF (20): +0.072, which flipped from -0.177 in one bar. That is a sharp improvement and the first accumulation reading in this decline. It is one bar old and not yet confirmed. [Accumulation]
- ADX (14): 29.6 and rising, with −DI (40.2) at double +DI (20.0). Sellers are firmly in control of a strong trend. +DI is ticking up from 14.8 to 20.0 and −DI is easing from 45.8 to 40.2. [Strong Trend – Bearish]
- Volume: 28.29M, the largest bar on the chart, on a green candle. This is a possible capitulation or reversal attempt, but it needs follow-through. [Bullish short-term, unconfirmed]
- VWAP / SMAs: Price is slightly above VWAP ($881.72), a minor positive. It is below SMA50D ($978.71), which is falling, and far above SMA200D ($746.83), so the long-term uptrend is intact while the short-term trend is down. [Neutral/Bearish]
DIVERGENCES & TRENDS
- No clear bullish RSI divergence yet. RSI made a higher low (about 26.8 vs 28.5 on the last bars), but price made lower lows, so nothing is confirmed.
- The EMA13/34 bearish cross, the MACD bearish cross (Oct 30) and the −DI dominance all agree with each other.
- The Oct 30 gap down of about -4.7% broke the Oct 22–29 rally structure. The rally failed at SMA50D (about $980), forming a lower high against the ~$1,050–1,090 September/October peaks.
- The last-bar CMF flip and the volume spike are the main counter-signals, pointing to a possible relief bounce.
- There is no death cross. SMA50D is far above SMA200D, so this is a pullback within a larger uptrend.
CHART PATTERNS
- The broad structure is a lower-high / lower-low downtrend after a failed rally at SMA50D, similar to the Bearish Flag/Pennant idea from the reference. Any bounce into $900–$915 would be a flag-like retracement under falling EMAs.
- A possible bearish continuation target from the Oct 30 drop (~$45) measured from a $900–$915 bounce high gives roughly $855–$870.
- A Bullish Double Bottom is possible only if the $866 low holds and price clears $915. That is not confirmed.
POTENTIAL SCENARIOS
- Scenario 1: Bearish Failed Bounce and Continuation — Price bounces toward the EMA13/EMA34 zone, is rejected there, and rolls over toward the lower Bollinger Band. Trigger: rejection at $900–$915 or a close below $866. Target: $850–$860. Invalidation: daily close above $915. (45% probability)
- Scenario 2: Bullish Relief Rally — The high-volume bounce, positive CMF and oversold RSI lead to a mean-reversion move toward the mid-band. Trigger: close above $900.69 with volume. Target: $915–$935. Invalidation: close below $866. (40% probability)
- Scenario 3: Neutral Consolidation — Price chops between $866 and $900 as the market digests the gap. Trigger: low-volume inside days. Target: about $880–$890. Invalidation: close outside the $866–$915 range. (15% probability)
PRICE TARGETS
- Target Price: $872.00 (6-day)
- Expected Range: $846.00 to $900.00 (width $54, about 6.1% of current price, appropriate for a 6-day horizon)
- Key Levels: Support at $850.39, Resistance at $900.69
OVERALL BIAS
OVERALL BIAS: BEARISH - Trend indicators (MACD bearish cross, −DI at double +DI with ADX near 30, price under falling EMAs and SMA50D) outweigh the oversold bounce signals. Overhead resistance at $900–$915 is likely to cap any relief rally, with a modest drift back toward the $850–$870 area. The high-volume green bar and positive CMF keep conviction modest.
This is educational analysis and not financial advice.