ASTS 13-day bearish forecast — Nov 1, 2026
- Bias: Bearish
- Timeframe: 13 days (made Nov 1, 2026, target date Nov 13, 2026)
- Price at analysis: $40.99
- Price target: $38.90
- Expected range: $36.50 – $41.80
- Result: Correct (-22.2%) — closed at $31.90 on Nov 13, 2026; quality score 50/100
Get a free AI analysis of ASTS today
Analysis
TECHNICAL INDICATORS
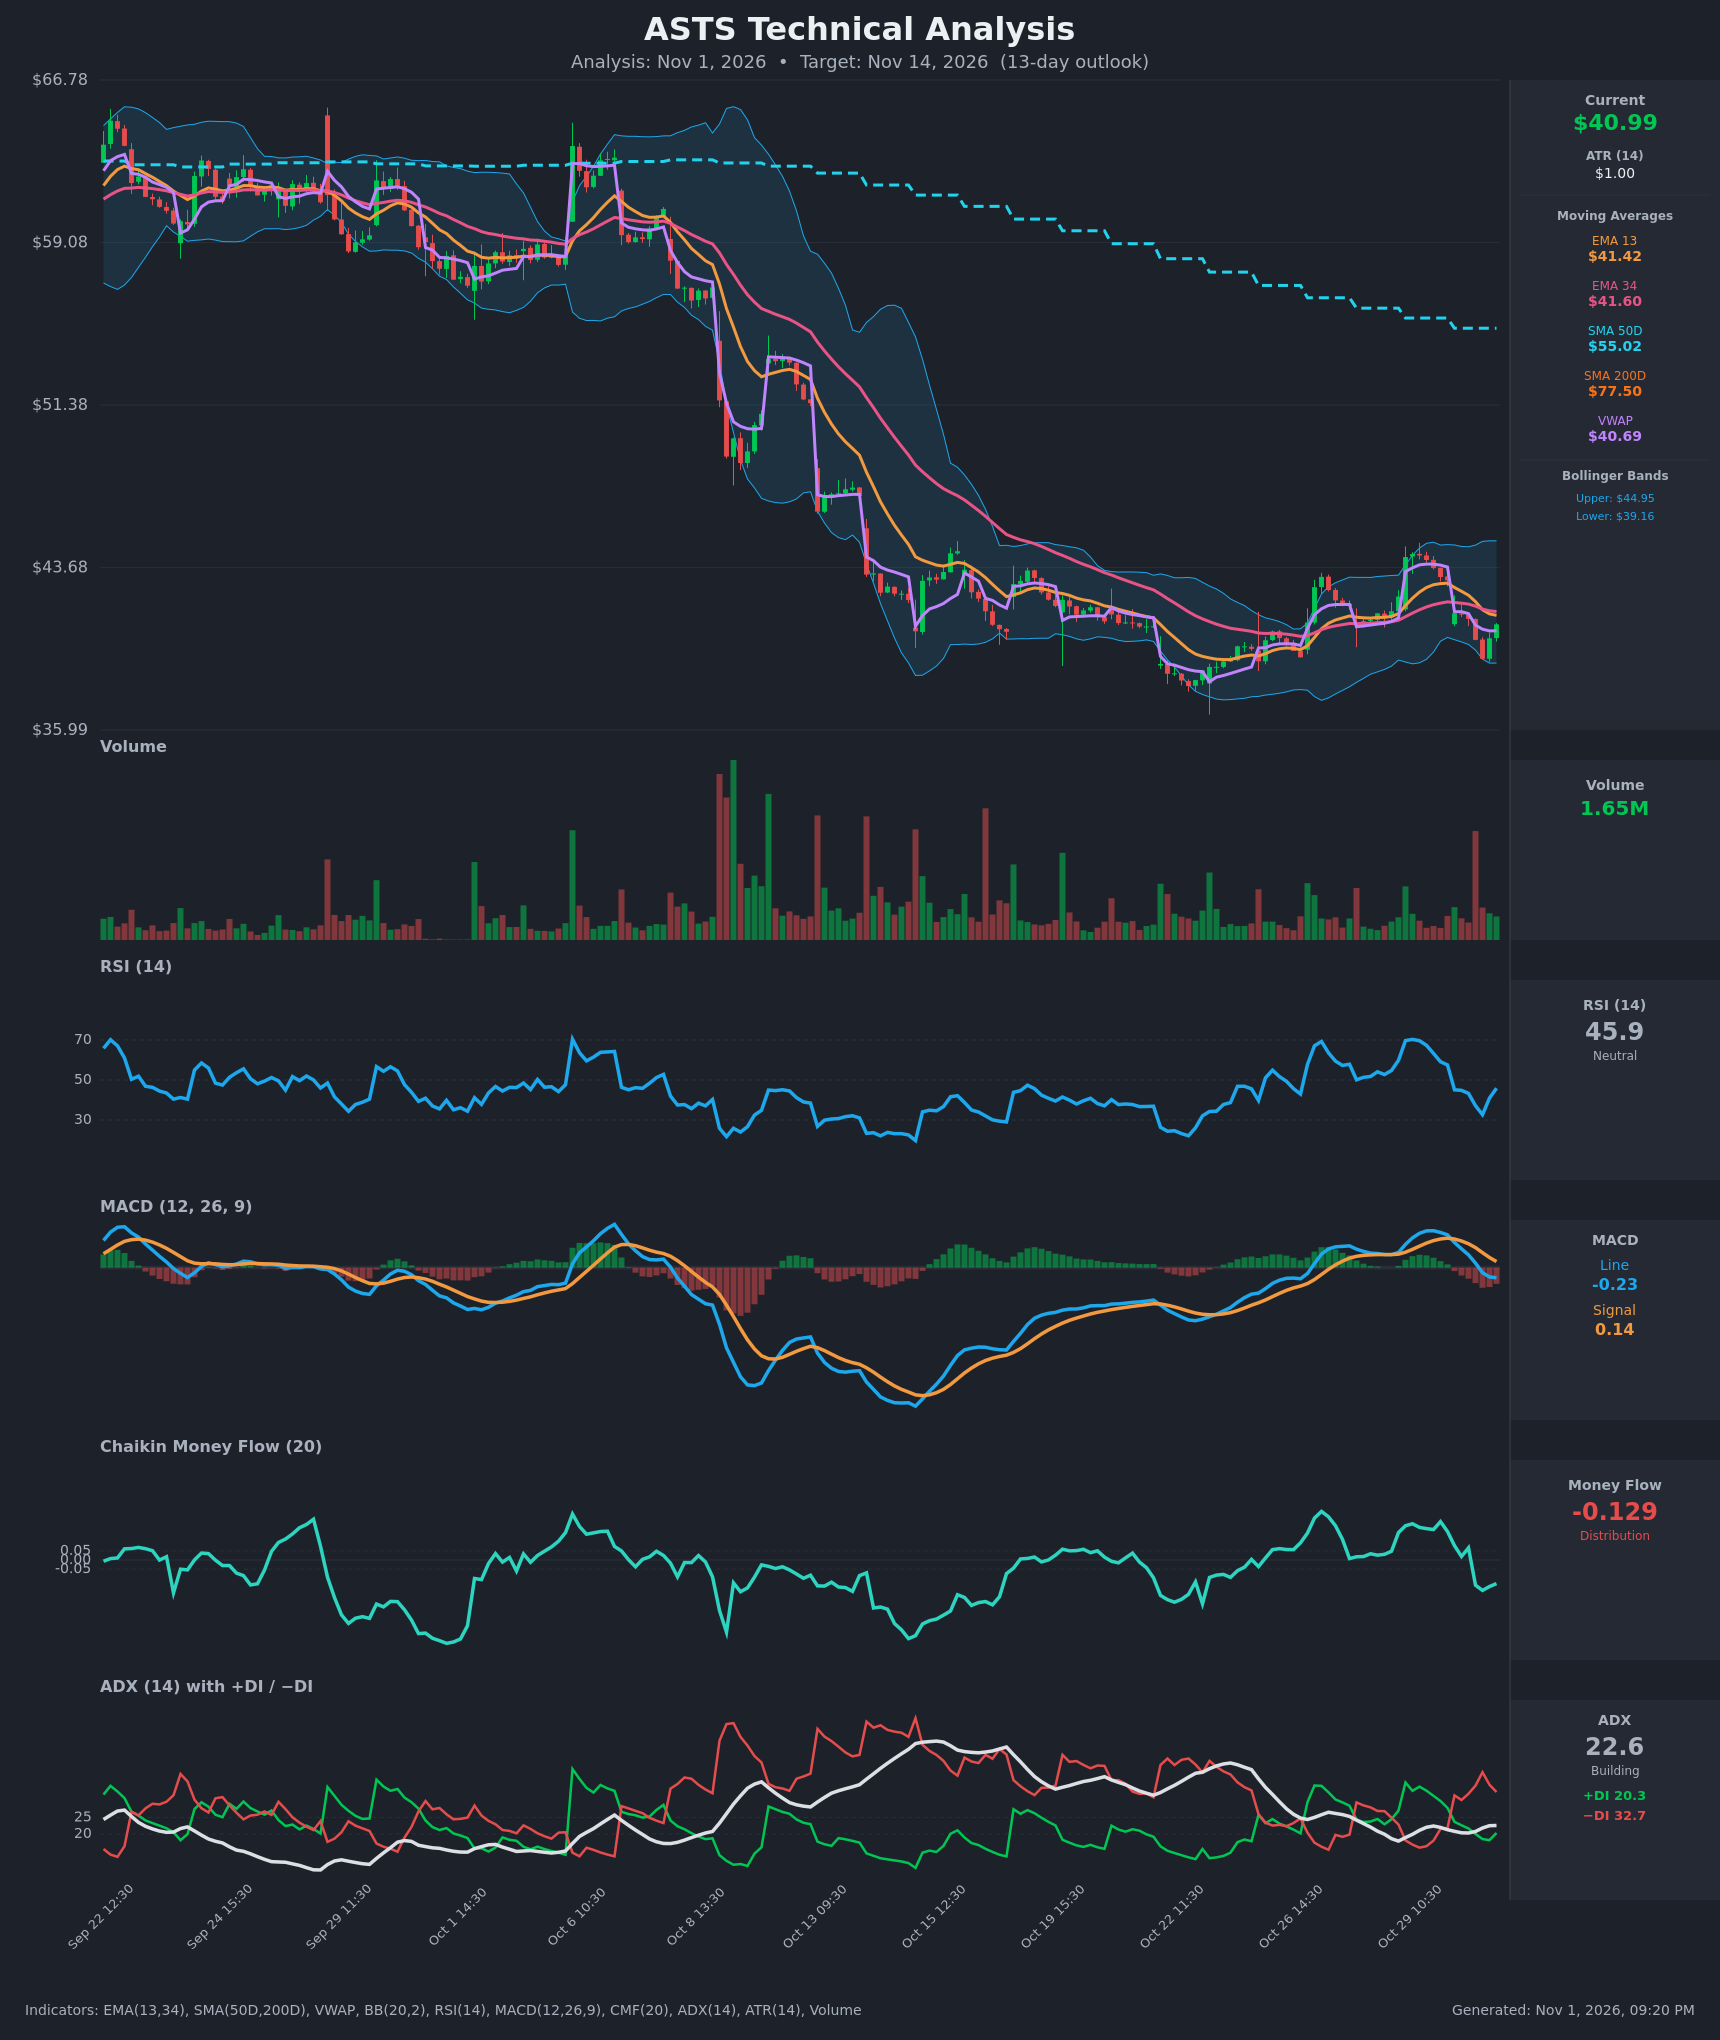
- RSI (14): 45.89. It fell to about 32.7 on Oct 30 13:30 (near oversold), then bounced to 45.9. It is below the 50 midline and recovering from a low base, so momentum is still soft. [Neutral]
- 20 EMA: The supplied values are EMA13 $41.42 and EMA34 $41.60. Price at $40.99 is below both, and EMA13 has crossed below EMA34 (Oct 30 13:30). Both averages are now overhead resistance. [Bearish]
- MACD: Line -0.233, signal 0.140, so the line is below the signal. The bearish crossover occurred around Oct 30 13:30. The histogram is negative and widening, and the line has just crossed below zero. [Bearish]
- Bollinger Bands (20): Upper $44.95, lower $39.16, so price is in the lower half of the band, about 32% of the way up from the lower band. The recent low pierced the lower band and price bounced back inside. The bands are fairly narrow compared with the earlier selloff, which points to compressed volatility. [Neutral]
- CMF (20): -0.129, below the -0.05 threshold and turned negative on Oct 30 from +0.15–0.21 earlier in the week. This is a sharp swing to distribution. [Distribution]
- ADX (14): 22.6, borderline and slightly rising, with −DI (32.7) well above +DI (20.3). Trend strength is only moderate, but bears control direction. [Weak-to-Moderate Trend, Bearish]
- Volume: 1.65M, average to slightly below average. There was a large-volume red bar on the Oct 30 drop and only modest volume on the bounce. The bounce lacks conviction. [Bearish-leaning]
DIVERGENCES & TRENDS
- No clear divergence is visible. RSI's low of ~32.7 is shallower than the earlier oversold readings (~25) while price is near the Oct 22 lows around $37–38. This is a modest sign that downside momentum is fading, but it is not a true bullish divergence.
- The longer-term trend is firmly bearish. Price is far below SMA50D ($55.02) and SMA200D ($77.50), and the 50D is well below the 200D (an established death cross). Both are falling.
- Short-term trend: the Oct 29 spike to ~$44.3 was rejected, and price has since given back the whole move. The EMA13/34 bearish cross, the MACD bearish cross, the DI flip (−DI over +DI) and CMF turning negative all happened within about a day, so they confirm one another.
- Price sits on VWAP ($40.69), a pivot point. Holding above it is a small positive, but failure would open a retest of the lower band.
CHART PATTERNS
- Over the past 2–3 weeks, price has been basing in the $37–$44.5 range after a steep decline from the $60s. The structure resembles a Bearish Pennant / Flag continuation (a consolidation after a sharp drop) or a loose Bullish Falling Wedge / Double Bottom attempt around $37–$38.
- Lower highs ($44.5 on Oct 29 vs. earlier peaks) and the failure at the upper band favor the bearish continuation read. The measured move from the range is a retest of $37–$38 and potentially a break lower to ~$35.
- A bullish double bottom needs a close above ~$44.5–45, which looks unlikely within 13 days given the overhead EMAs.
POTENTIAL SCENARIOS
- Scenario 1: Bearish Continuation Lower — Price stays capped below the EMA13/34 (~$41.4–41.6), loses VWAP and drifts to retest the Oct 22 lows. Distribution (CMF), −DI dominance and the negative MACD support this. Trigger: close below ~$39.15 (lower band) and VWAP. Target: $37.00–$38.00, with extension to ~$36. Invalidation: daily close above ~$42.00 with rising volume. (50% probability)
- Scenario 2: Neutral Range-Bound Chop — Price oscillates between ~$38.5 and ~$43, with the EMAs acting as a ceiling and the $37–38 zone as support. Trigger: failure to break either side with ADX staying near 20. Target: $40–$42. Invalidation: close outside $38 or $44. (28% probability)
- Scenario 3: Bullish Relief Rally — Shallow RSI lows and a bounce off the lower band spark a short squeeze back toward the upper band and the Oct 29 high. Trigger: reclaim of $41.6 (EMA34) and MACD histogram turning up. Target: $44–$45. Invalidation: loss of $39.00. (22% probability)
PRICE TARGETS
Timeframe: 13 days, so the range width should be about 8–12% of the current price (roughly $3.30–$4.90). With ATR around $1, a 13-day move of roughly 1.5–2 ATR on either side is plausible. I'm using a slightly wider, downward-skewed range of about 13%.
- Target Price: $38.90 (about 5.1% below current price)
- Expected Range: $36.50 to $41.80 (width $5.30, about 12.9% of the current price, slightly above the guide to reflect the volatile, high-beta nature of ASTS)
- Key Levels: Support at $39.16 (lower Bollinger Band; below it, $37.00 from the Oct 22 low), Resistance at $41.60 (EMA34, with EMA13 at $41.42 just below it)
OVERALL BIAS
OVERALL BIAS: BEARISH - The EMA13/34 and MACD bearish crossovers, −DI well above +DI, negative CMF (distribution) and a deeply bearish long-term structure (below falling 50D/200D with a death cross) outweigh the modest RSI recovery. Rallies into $41.4–41.6 are likely to face selling pressure.
This is educational analysis and not financial advice.